Unconventional Gas Activity in Pennsylvania
Recently, the Pennsylvania Department of Environmental Protection (PADEP) Office of Oil and Gas Management changed a column on a variety of their data that they distribute. Now, instead of indicating whether or not a well is permitted or drilled into the Marcellus Shale, we are given data as to whether or not it is an unconventional well. This is a move likely designed to incorporate the Utica Shale, and perhaps other formations as well. PADEP defines unconventional wells as:
An unconventional gas well is a well that is drilled into an Unconventional formation, which is defined as a geologic shale formation below the base of the Elk Sandstone or its geologic equivalent where natural gas generally cannot be produced except by horizontal or vertical well bores stimulated by hydraulic fracturing.
Historically, of course, the lion’s share of unconventional wells in Pennsylvania have been drilled into the Marcellus Shale, although I have encountered the odd report about activity in the Utica. Interestingly, just across the state line in Ohio, the situation is more or less reversed; evidently operators in the Buckeye State find the Utica to be more enticing than the Marcellus. In Pennsylvania, these distinctions will unfortunately be lost for us moving forward because they will be lumped together as unconventional, but really, the process is the same and the associated concerns are too. We just won’t be able to effectively compare the two black shale formations to each other in Pennsylvania.
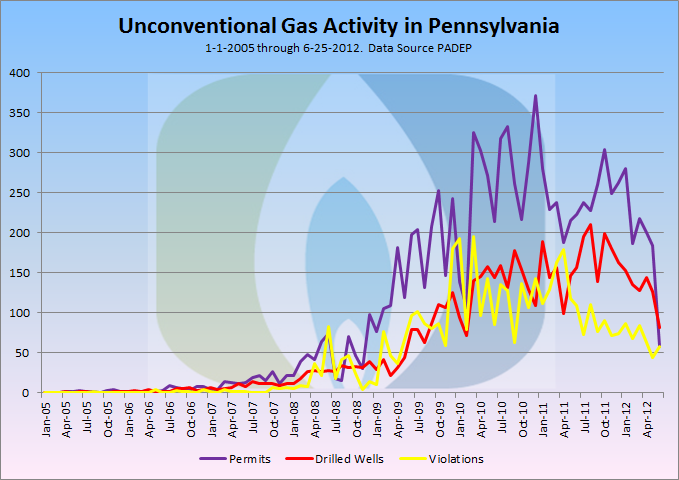
I always feel like changes in data are a good opportunity for a retrospective. Here, perhaps for the first time ever, is a single chart with permits, violations, and drilled wells, dating back to 2005:

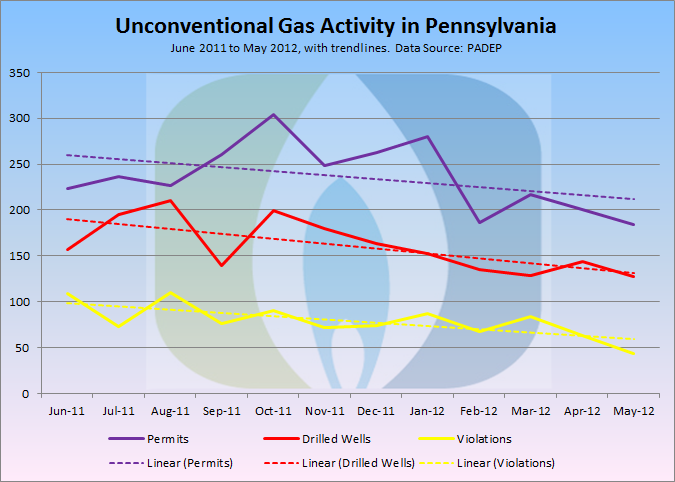
Obviously, June 2012 is not yet over, and the data though the 25th represents only about 83% of what we would expect for month long totals. However, the decline in recent months is notable on all three fronts. Let’s zoom in, so to speak, and take a look at the last 12 complete months, and add some Excel generated trend lines while we are at it:

While there is obviously significant fluctuation on a month to month basis, the negative slope of the trend lines show that these three indicators of activity for unconventional wells in Pennsylvania are all well down over a one year period.
Here is the data spatially (with violations upload pending):
Notes: At the risk of being redundant from post to post, I always like to say a few a words about how I worked with the data, just in case you want to try this at home and your graph looks a little different. The permits require a bit of preparation, because there can be multiple items listed for the same well. While that data can be valuable, it’s not really what we are looking for in this analysis. I have resolved this by using the earliest permit action for any given well API number. The drilled wells are unchanged from the original, as each well appears on the downloaded dataset exactly once. The violations are also unchanged from the original in terms of the number of records used. This results in a number of actions greater than the official DEP count of violations, which are apparently tallied by the number of violation ID’s issued. As I have mentioned elsewhere there are numerous issues with the violation dataset, and my perception is that there was a period of time in which there was a lack of uniformity in how the data were entered, which is reflected in data trail left behind. So while using all records from the data download may inflate the number of of violations, to use only the unique violation ID’s will yield a number that is too small.
What is the number of active natural gas unconventional wells in the the US?
Good question, Gus. We’ll be working on answering this in the coming weeks. It requires pulling data from each state separately, so it’s a hefty data pull.
Matt
is there corresponding data available for NY state?
Mike, there is currently no finalized generic environmental impact statement that permits unconventional drilling in New York State, due to the moratorium that has been in place and indecision in Albany about how or if to go ahead with high volume hydraulic fracturing for shale gas. One interesting place to look at data on wells in New York is DEC’s Oil and Gas Database: http://www.dec.ny.gov/cfmx/extapps/GasOil/search/wells/index.cfm You can either do simple queries, or build complex statements to narrow your questions.
Additionally, unlike Pennsylvania, New York State does not maintain a publicly accessible database that catalogs oil and gas drilling violations. Records are kept as paper files in several of the Regional DEC offices (for example, in Avon, NY). Many of us in New York State have been pressuring DEC for several years to switch this system over to an electronic database so it is searchable both on a spatial and temporal basis, but to date, have not heard that such a system is in place.