Is Carroll Co. truly the king of Ohio’s Utica counties?
Yes and No…
By Ted Auch, Great Lakes Program Coordinator, FracTracker Alliance
We know from the most recent Ohio Department of Natural Resources (ODNR) permitting numbers that Carroll County, Ohio is home to 26% (461 of 1,778) of the state’s Utica permits and 43% (312 of 712) of all producing wells as of the end of Q3-20141 (Figure 1). But does that mean that the county will continue to see that kind of industrial activity for the foreseeable future? The primary question we wanted to ask with this latest piece is whether the putative “king” of the state’s Utica shale gas counties is indeed Carroll County.
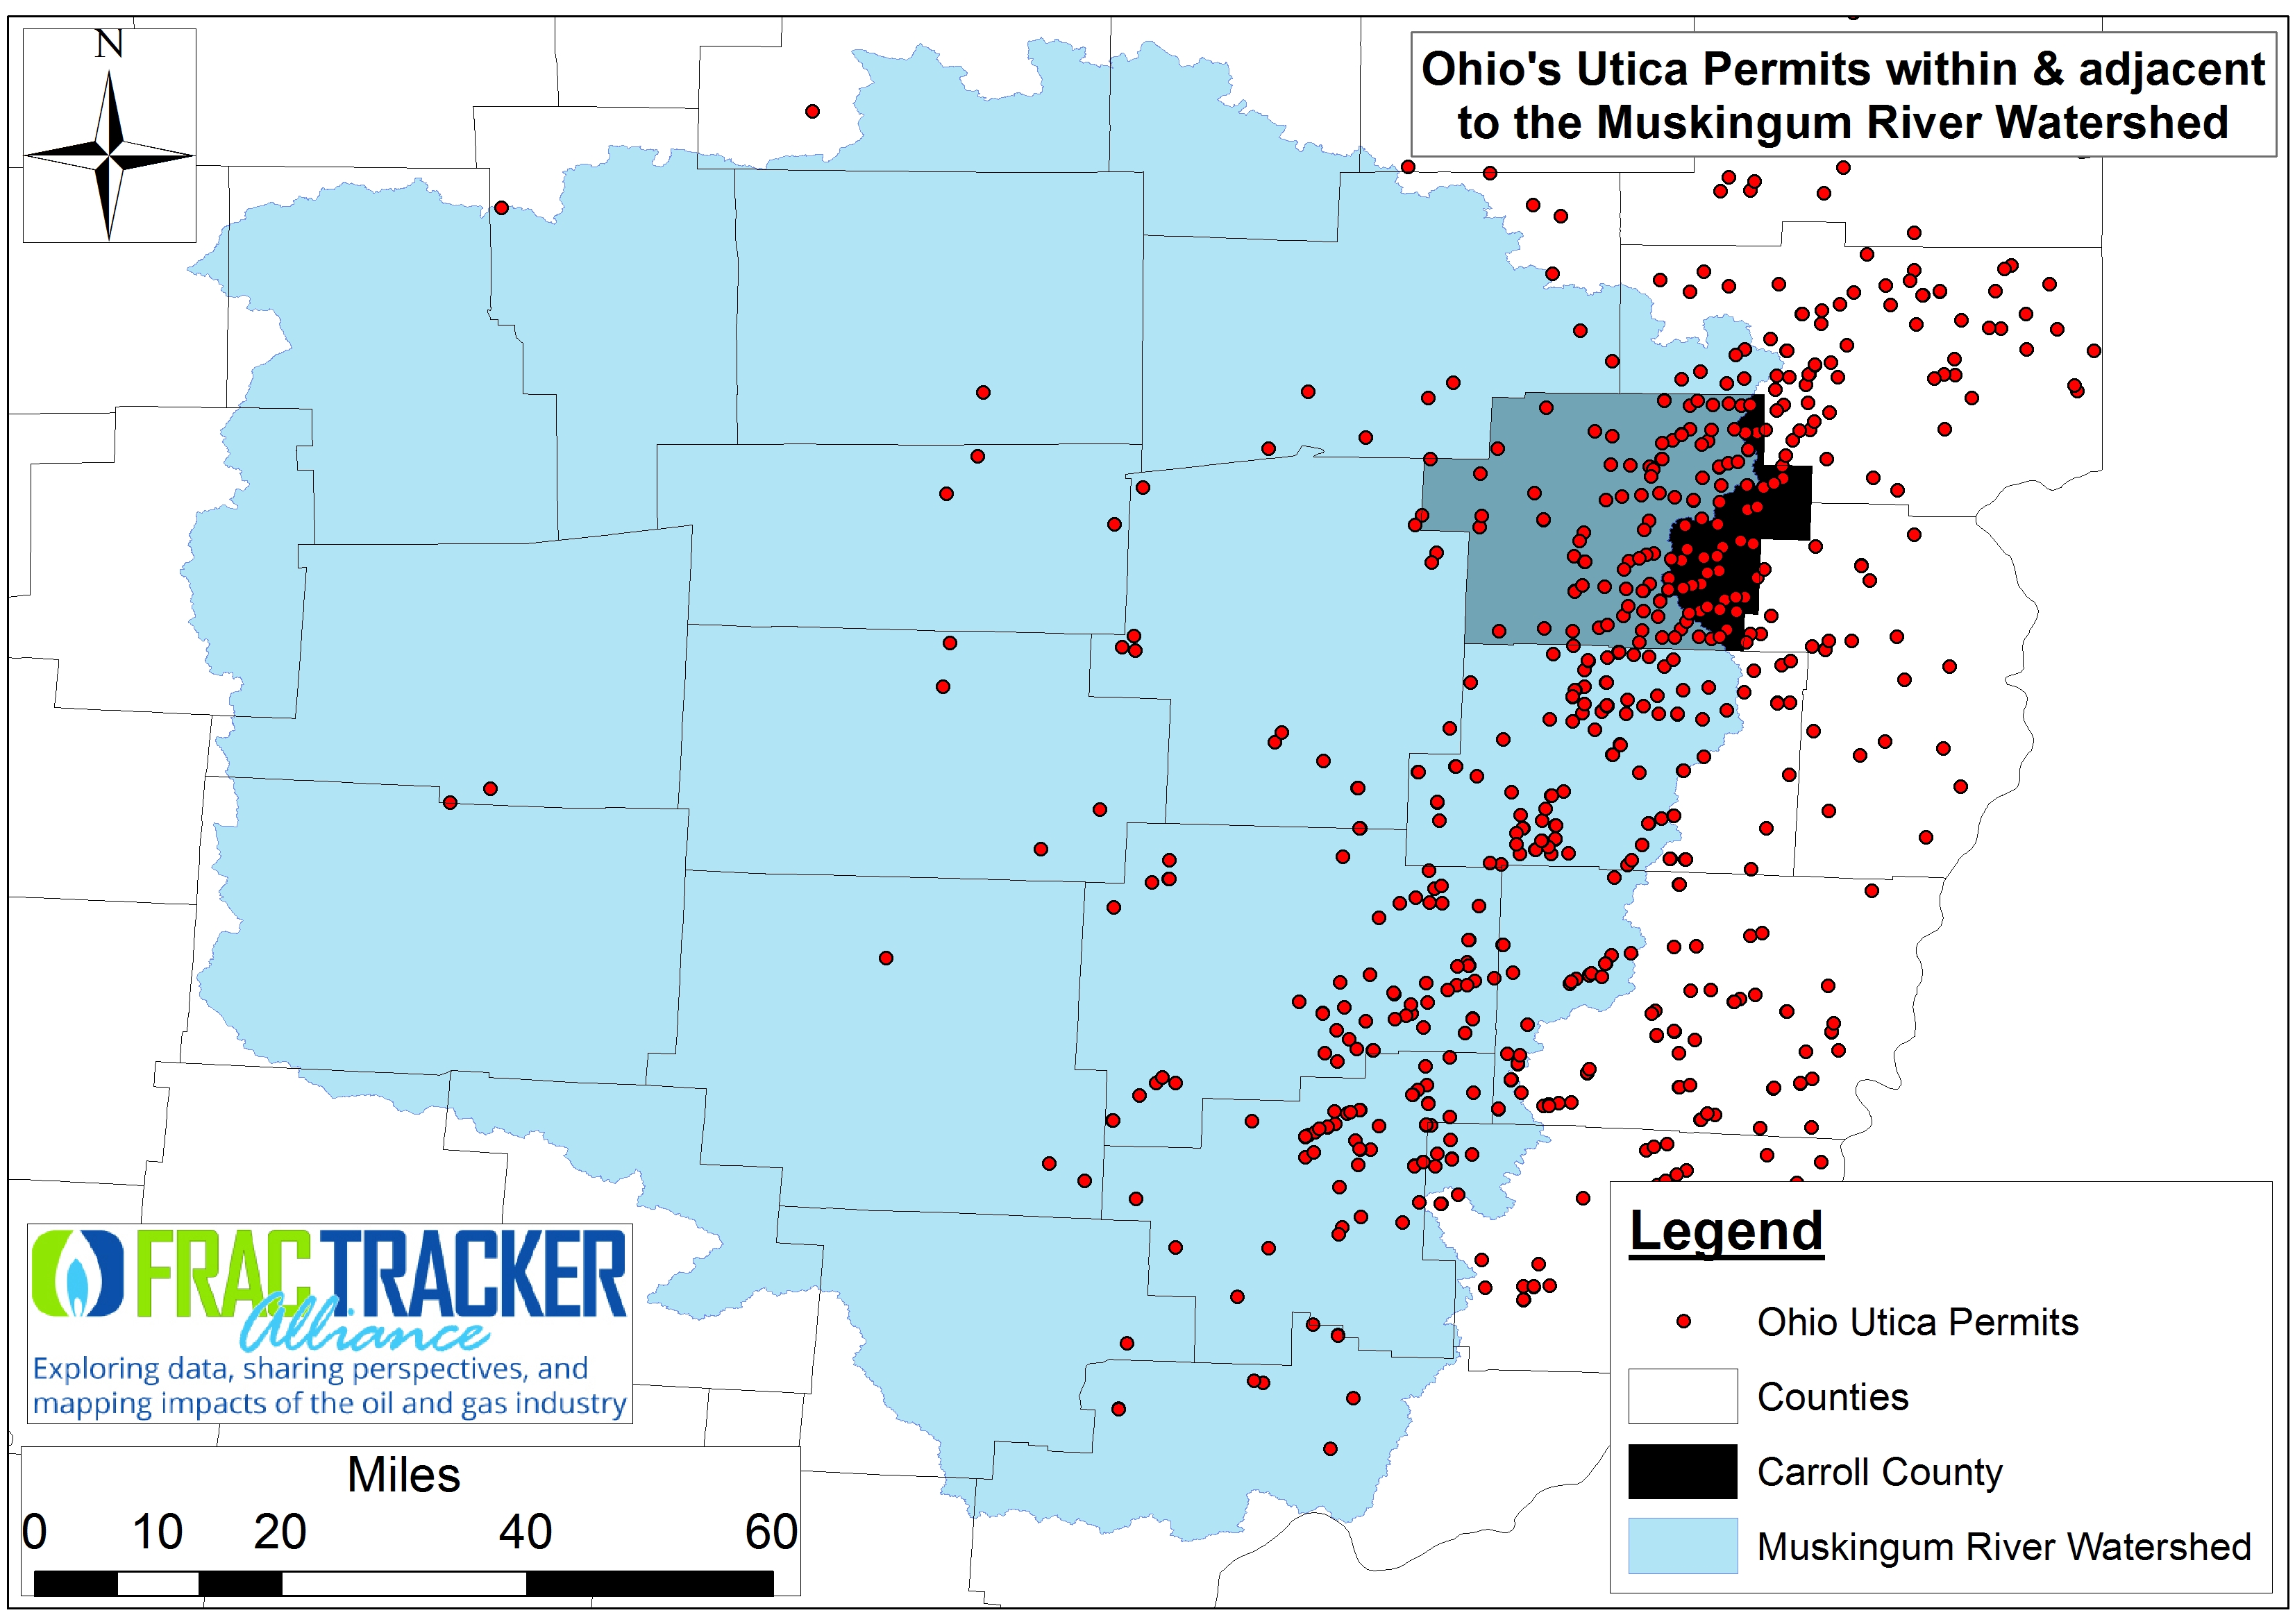
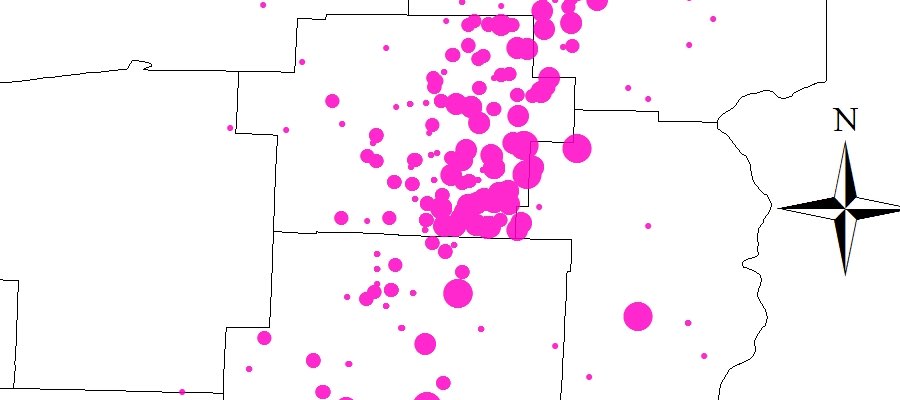
Fig 1. Ohio’s Utica Permits within & adjacent to the Muskingum River Watershed as of February, 2015
To do this we compiled an inventory of annual (2011-2012) and quarterly OH shale gas production numbers for 721 laterals throughout southeast OH.
Permitting and production numbers are not necessarily part and parcel to determine if Carrol Co is truly the king. We decided to investigate the production data and do a simple compare and contrast with the rest of the state’s 409 laterals on one side (ROS) and the 312 Carroll laterals on the other – focusing primarily on days of production and resulting oil, gas, and brine (Table 1 and infographic below).
Carroll vs. ROS Results
Permitting Numbers Breakdown
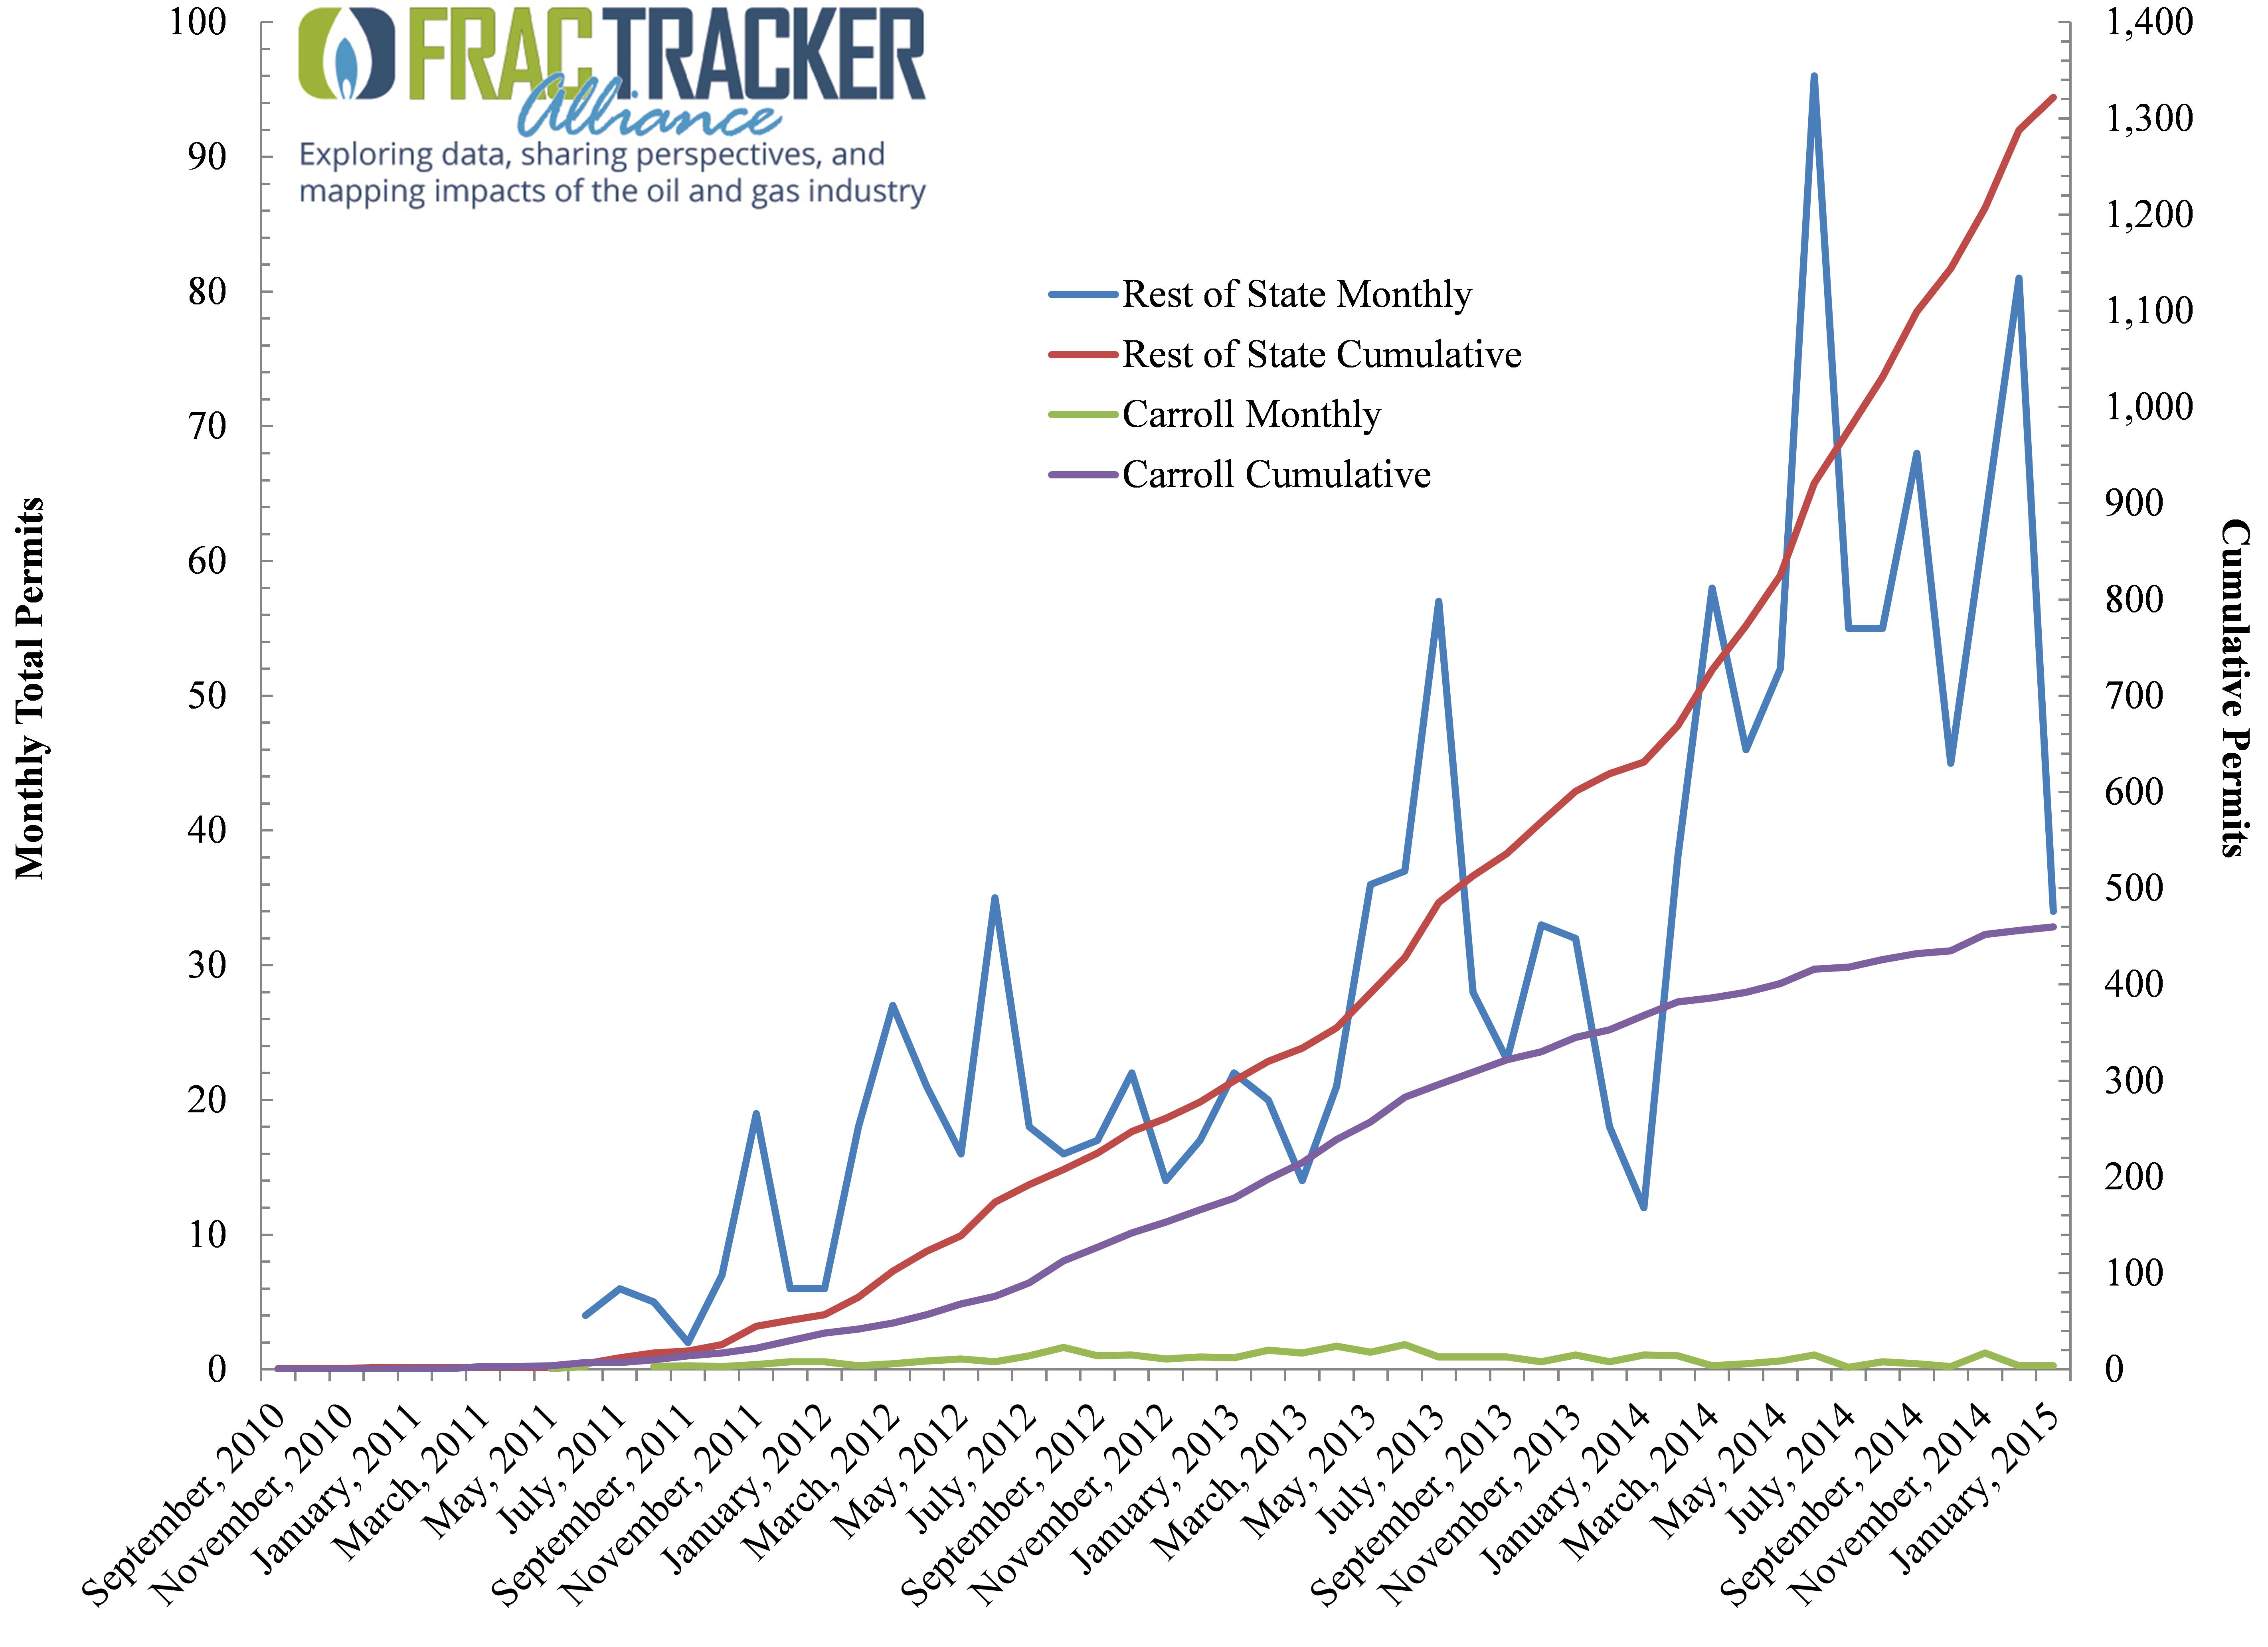
Fig 2. Monthly & cumulative Utica Shale permitting activity in Carrol County, OH vs. the ROS between September 2010 & January 2015
Between the initial permitting phase of September 2010 and January 2105 the number of Utica Shale permits issued in the ROS has averaged 29 per month vs. 10 per month in Carroll County. Permitting actually increased twofold in the ROS in the last 12 months (Figure 2). Conversely, permitting in Carroll County seems to have reached some sort of a steady state, with monthly permitting declining by 23% in the last 12 months. Carroll’s Utica permits generally constituted 47% of all permitting in OH but more recently has dipped to 44%. Newer areas of focus include Belmont, Guernsey, Noble, and Columbiana counties, just to name a few.
Production Days
Days in production is a proxy for road activity and labor hours. Carroll’s wells have the rest of the state beat for that metric, with an average of 292 (±188 days) days. The state average is 192 days, with significant well-to-well variability (±177 days). If we assume there was a total of 1,369 possible production days between 2011 and the end of Q3-2014, these averages translate to 21% and 14% of total possible production days for Carroll and ROS, respectively.
Oil Production
Carroll falls short of the ROS on a total and per-day basis of oil production, although the 442-barrel difference in total oil production is likely not significant. Carroll wells are producing 74 barrels of oil per day (OPD) (±73 OPD) compared to 96 OPD (±122 OPD) for the rest of the state; however, well-to-well variability is so large as to make this type of comparison quite difficult at this juncture. Fifty-seven percent of OH’s 11,361,332 barrels of Utica oil has been produced outside of Carroll County to date. This level of production is equivalent to 16,231 rail tanker cars and roughly 00.18% of US oil production between 2011 and 2013.
Natural Gas
The natural gas story is mixed, with Carroll’s 312 wells having produced 13,430 MCF more than the ROS wells. On a per-well basis, however, the latter are producing 3,327 MCF per day (MCFPD) (±3,477 MCFPD) relative to the 2,155 MCFPD (±1,264 MCFPD) average for Carroll’s wells. Yet again, well-to-well variability – especially in the case of the 409 ROS wells – is high enough that such simple comparisons would require further statistical analysis to determine whether differences are significant or not.
The natural gas produced here in OH currently amounts to roughly 00.51% of U.S. Natural Gas Marketed Production, according to the latest data from the EIA.
Waste – Brine
From a waste generation point of view, the ROS laterals have produced 41 more barrels of brine per day (BPD) than the Carroll laterals and 1,465 BPD since production began in 2011. On a per-day basis, the ROS laterals are producing more oil than waste at a rate of 1.92 barrels of oil per barrel of brine waste. Conversely, since production began these respective sums result in Carroll County laterals having produced 1.56 barrels of oil for every barrel of brine vs. the 1.40 oil-to-brine ratio for the ROS. Finally, it is worth noting that the 7,775,130 barrels of brine produced here in OH amounts to 13% of all fracking waste processed by the state’s 235+ Class II Injection wells.
What do these figures mean?
As we begin to compare OH’s Utica Shale expectations vs. reality we see that the “sweet spot” of the play is truly a moving target. The train seems to have already left – or is in the process of leaving – the station in Carroll County (Figures 3 and 4). It seems two of the most important questions to ask now are:
- How will this rapidly shifting flow of capital, labor, and resources affect future counties deemed the next best thing? and
- What will be left in the wake of such hot money flows?
Answers to these questions will be integral to the preparation for the inevitable sudden or slow-and-steady decline in shale gas activity. These dropouts are just the most recent in a long line of boom-bust cycles to have been foisted on Southeast OH and Appalachia. Effects will include questions regarding watershed resilience, local and regional resource utilization (Figures 5 and 6), social cohesion, tax-base uncertainty, roads, and a rapidly changing physical landscape.
Whether Carroll County can maintain its perch on top of the OH shale mountain is far from certain, but whether it will have to begin to – or should have already – prepare for the downside of this cliff is fact based on the above analysis.
Additional Figures and Charts
Table 1. Carroll County, OH production days and production of oil, gas, and brine on a per-day basis and in total between 2011 and Q3-2014 vis à vis the “Rest of State”
| Variable | Carroll (312) | Rest of State (409) | ||||
| Max | Sum | Mean | Max | Sum | Mean | |
| Total Days | 914 | 91,193 | 292±188 | 898 | 78,430 | 192±177 |
| Oil (Barrels) | ||||||
| Per Day | 453 | 23,190 | 74±73 | 601 | 39,109 | 96±122 |
| Total | 83,098 | 4,838,147 | 15,507 | 129,005 | 6,523,185 | 15,949 |
| Gas (MCF) | ||||||
| Per Day | 6,774 | 672,391 | 2,155±1,264 | 18,810 | 1,360,923 | 3,327±3,477 |
| Total | 2,196,240 | 168,739,064 | 540,830 | 3,181,013 | 215,706,401 | 527,400 |
| Brine (Barrels) | ||||||
| Per Day | 941 | 18,516 | 59±87 | 810 | 40,839 | 100±120 |
| Total | 36,917 | 3,105,260 | 9,953 | 99,095 | 4,669,870 | 11,418 |
| Oil Per Unit of Brine | ||||||
| Per Day | 1.25 | 1.92 | ||||
| Total | 1.56 | 1.40 | ||||
Figures 3a-d. Spatial distribution of Carroll County Utica Shale production days, oil (barrels), natural gas (MCF), and brine (barrels) on a per-day basis.
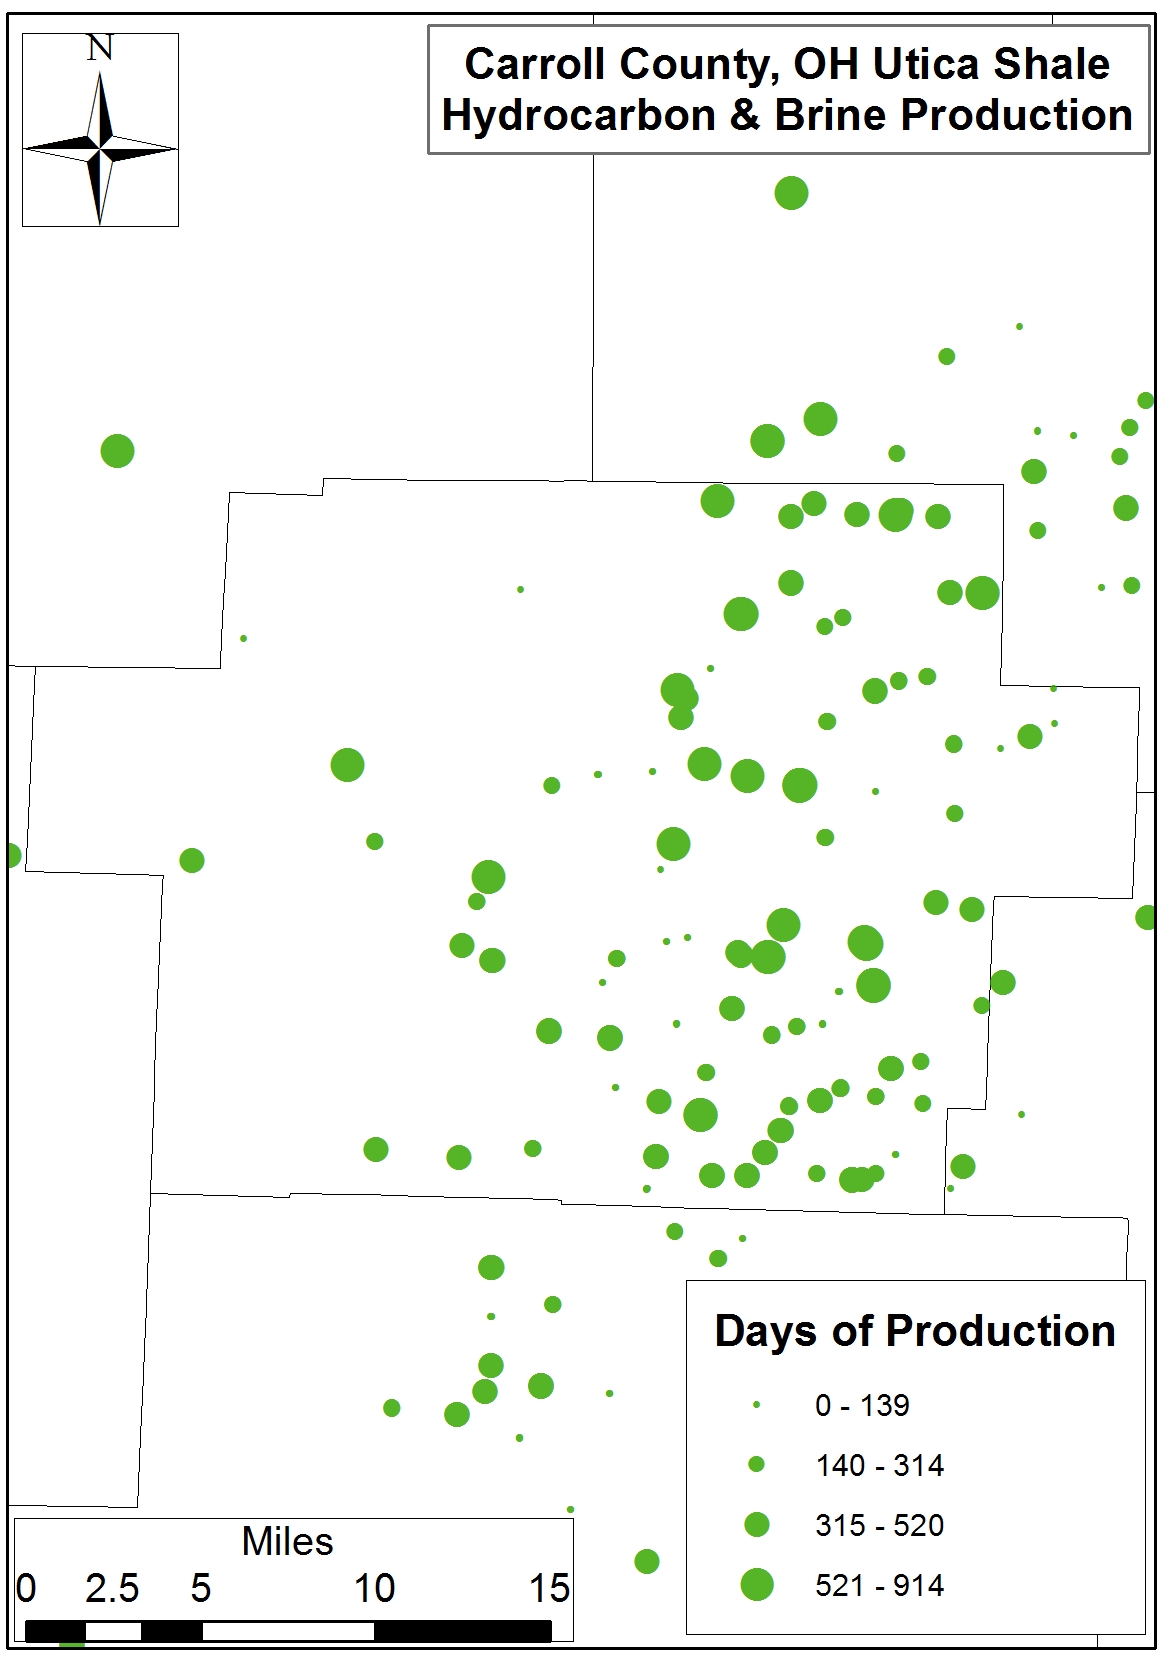
Fig 3a. Spatial distribution of Carroll Co. Utica Shale production days
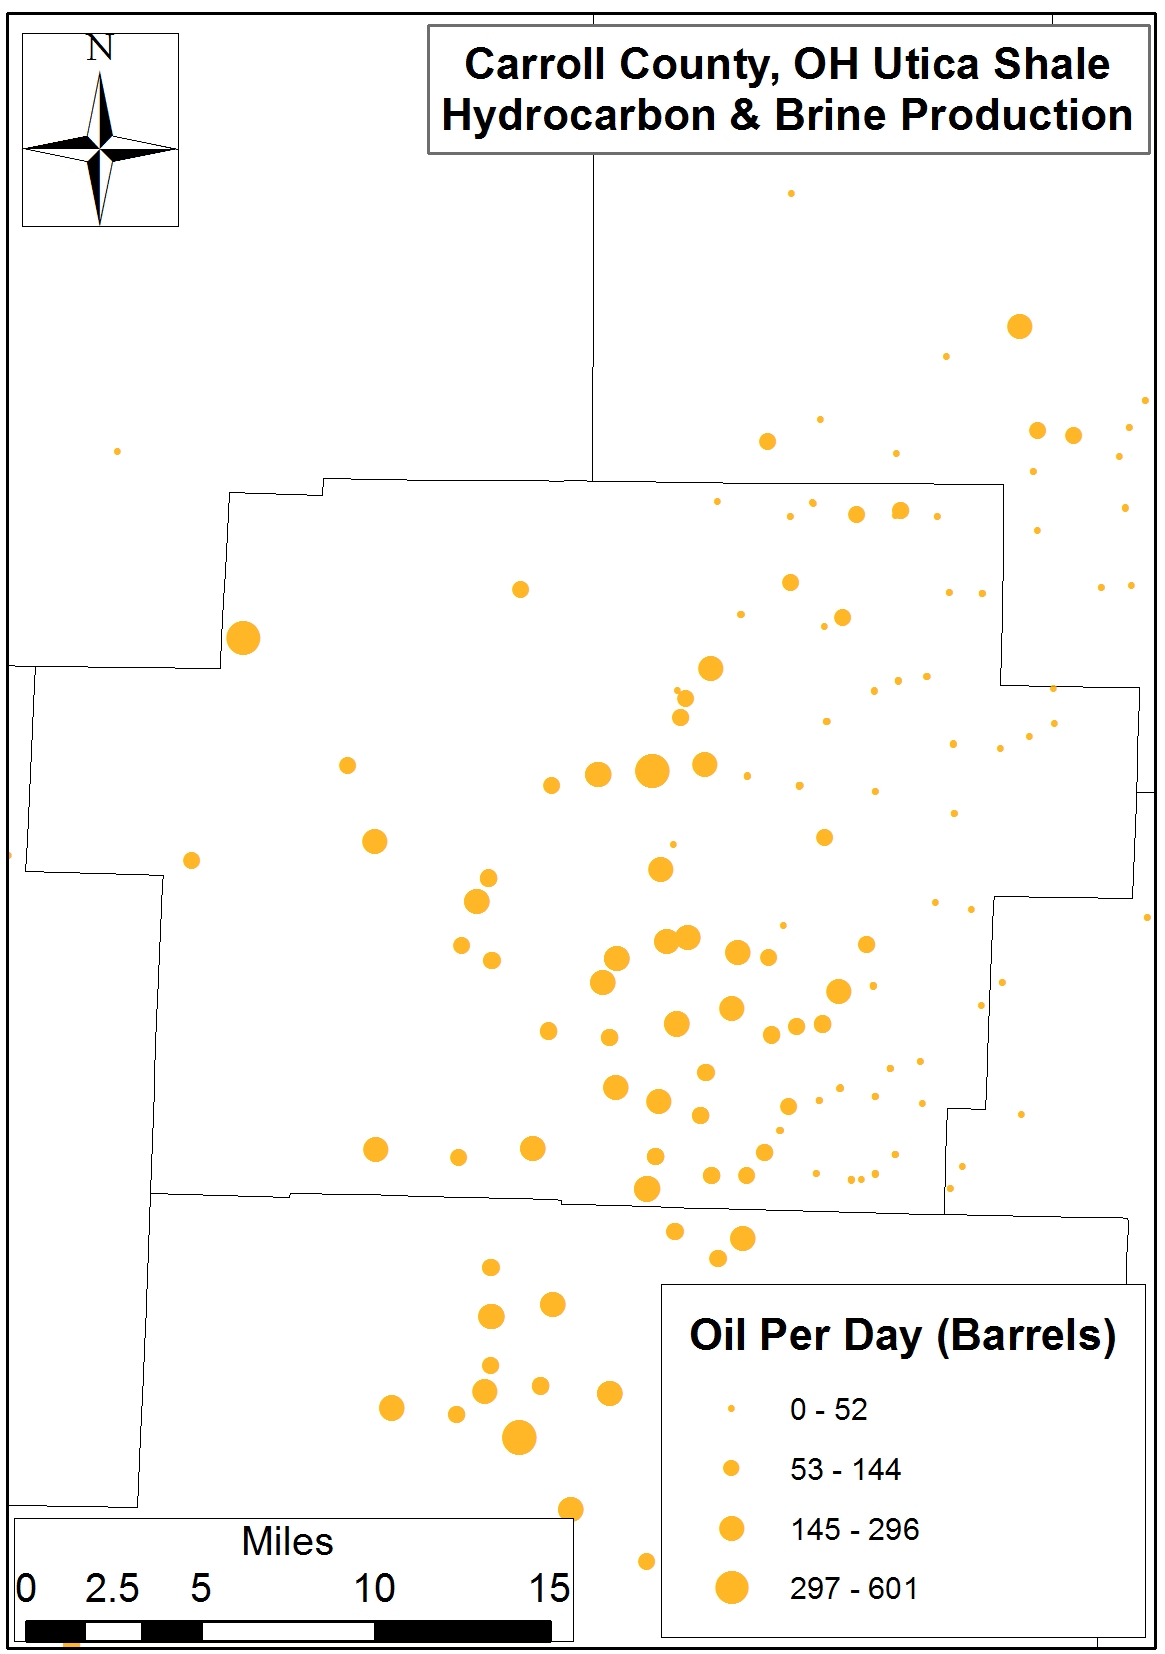
Fig 3b. Spatial distribution of Carroll Co. Utica Shale oil (barrels) production on per-day basis
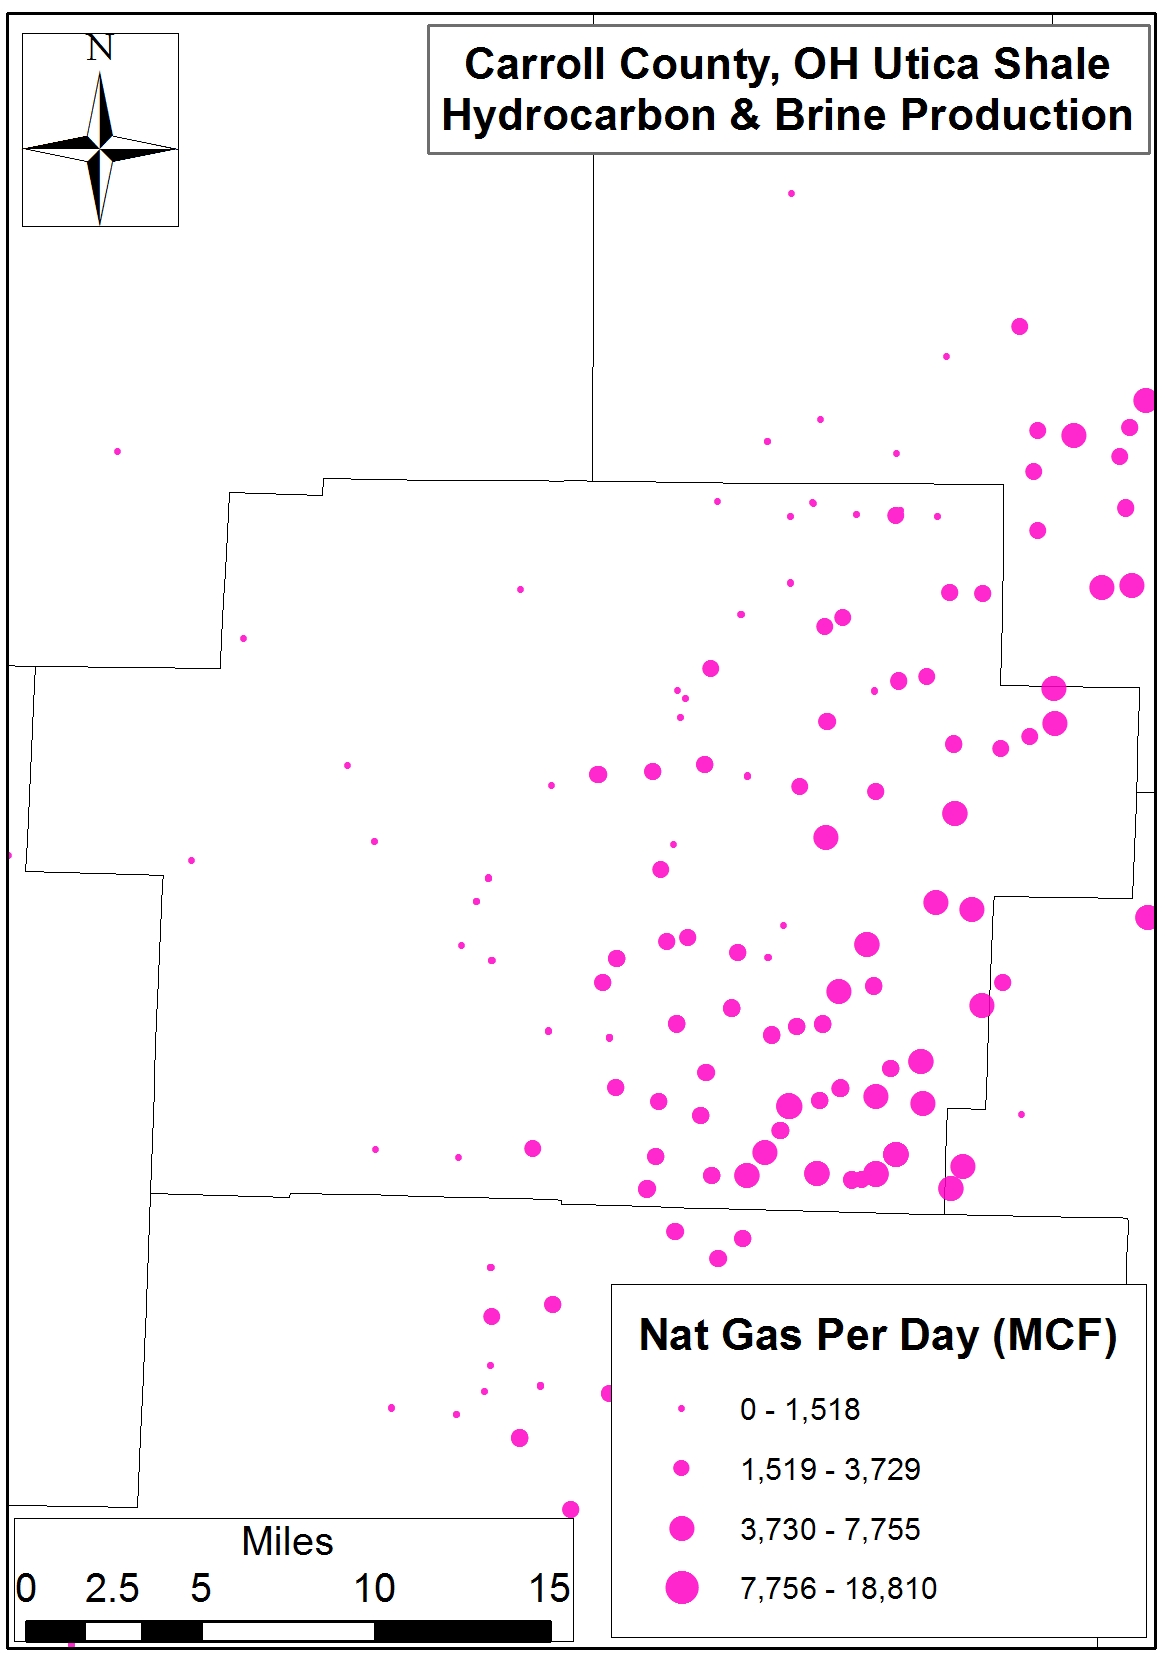
Fig 3c. Spatial distribution of Carroll Co. Utica Shale natural gas (MCF) production on per-day basis
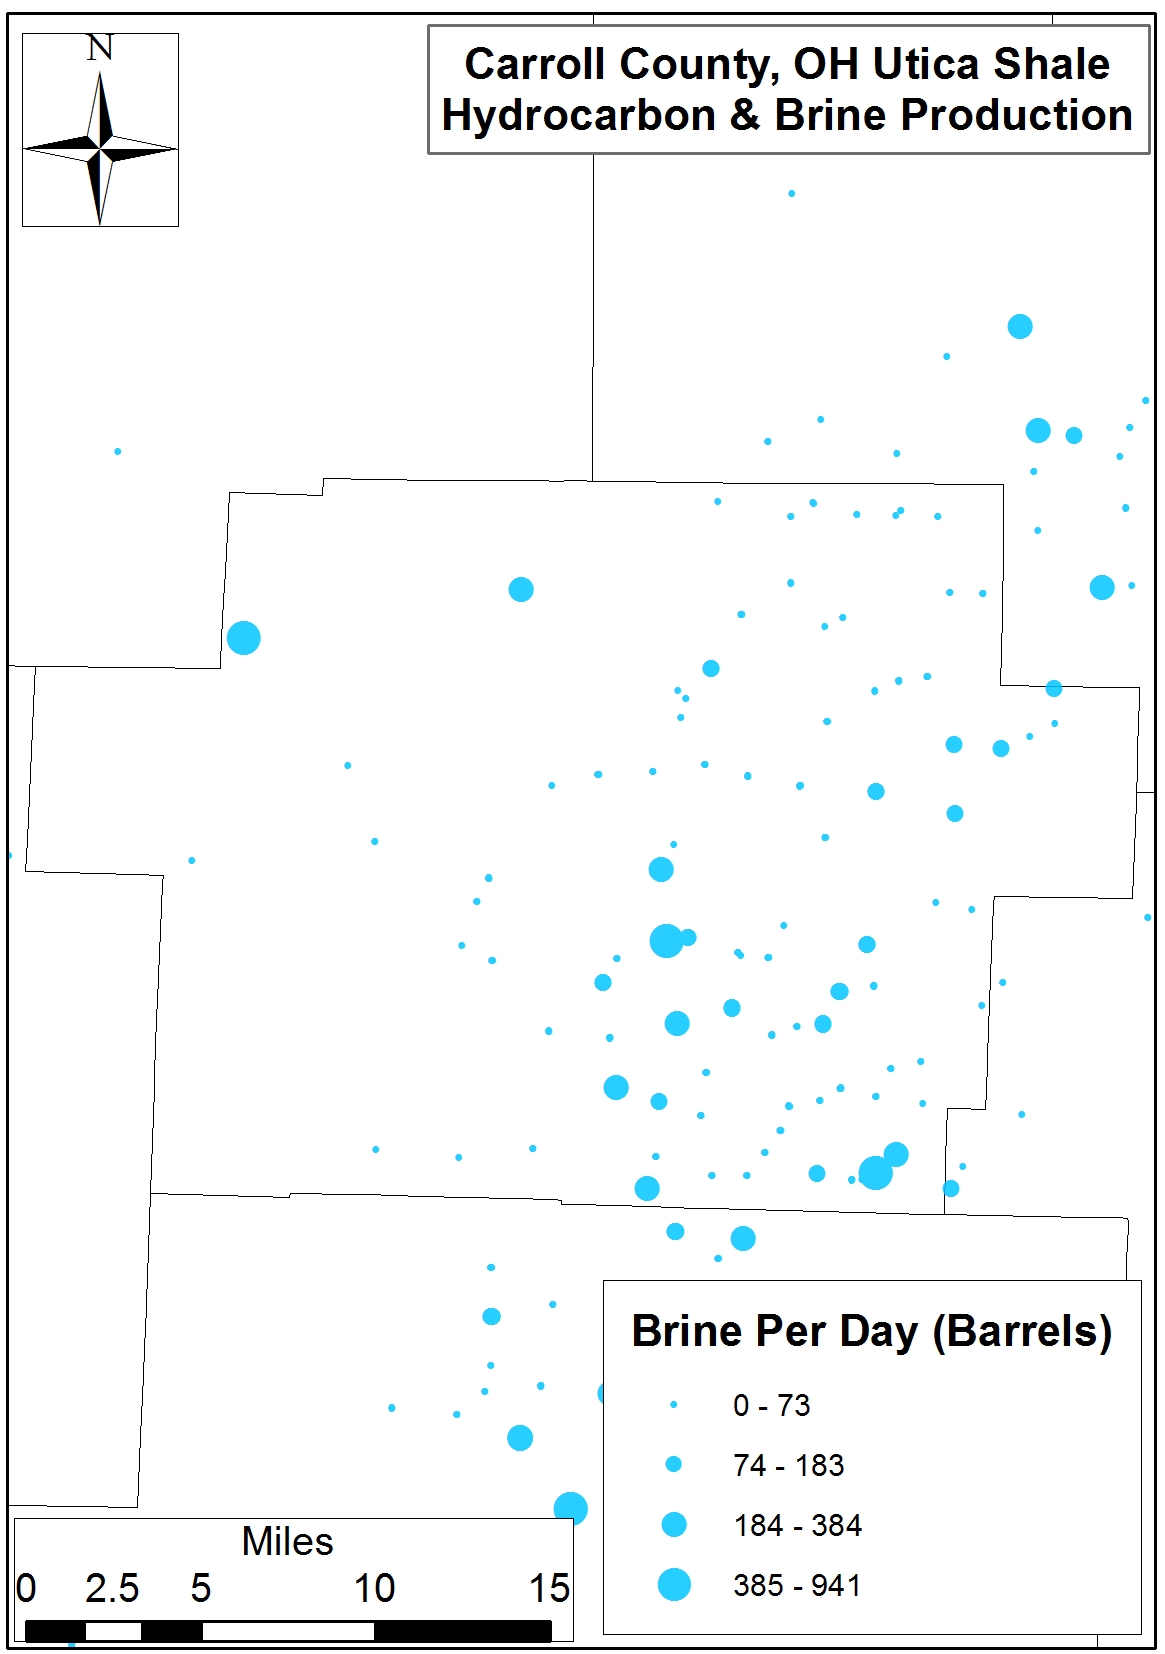
Fig 3d. Spatial distribution of Carroll County Utica Shale brine (barrels) production on a per-day basis
Figures 4a-d. Spatial distribution of OH Utica Shale production days, oil (barrels), natural gas (MCF), and brine (barrels) on a per-day basis.
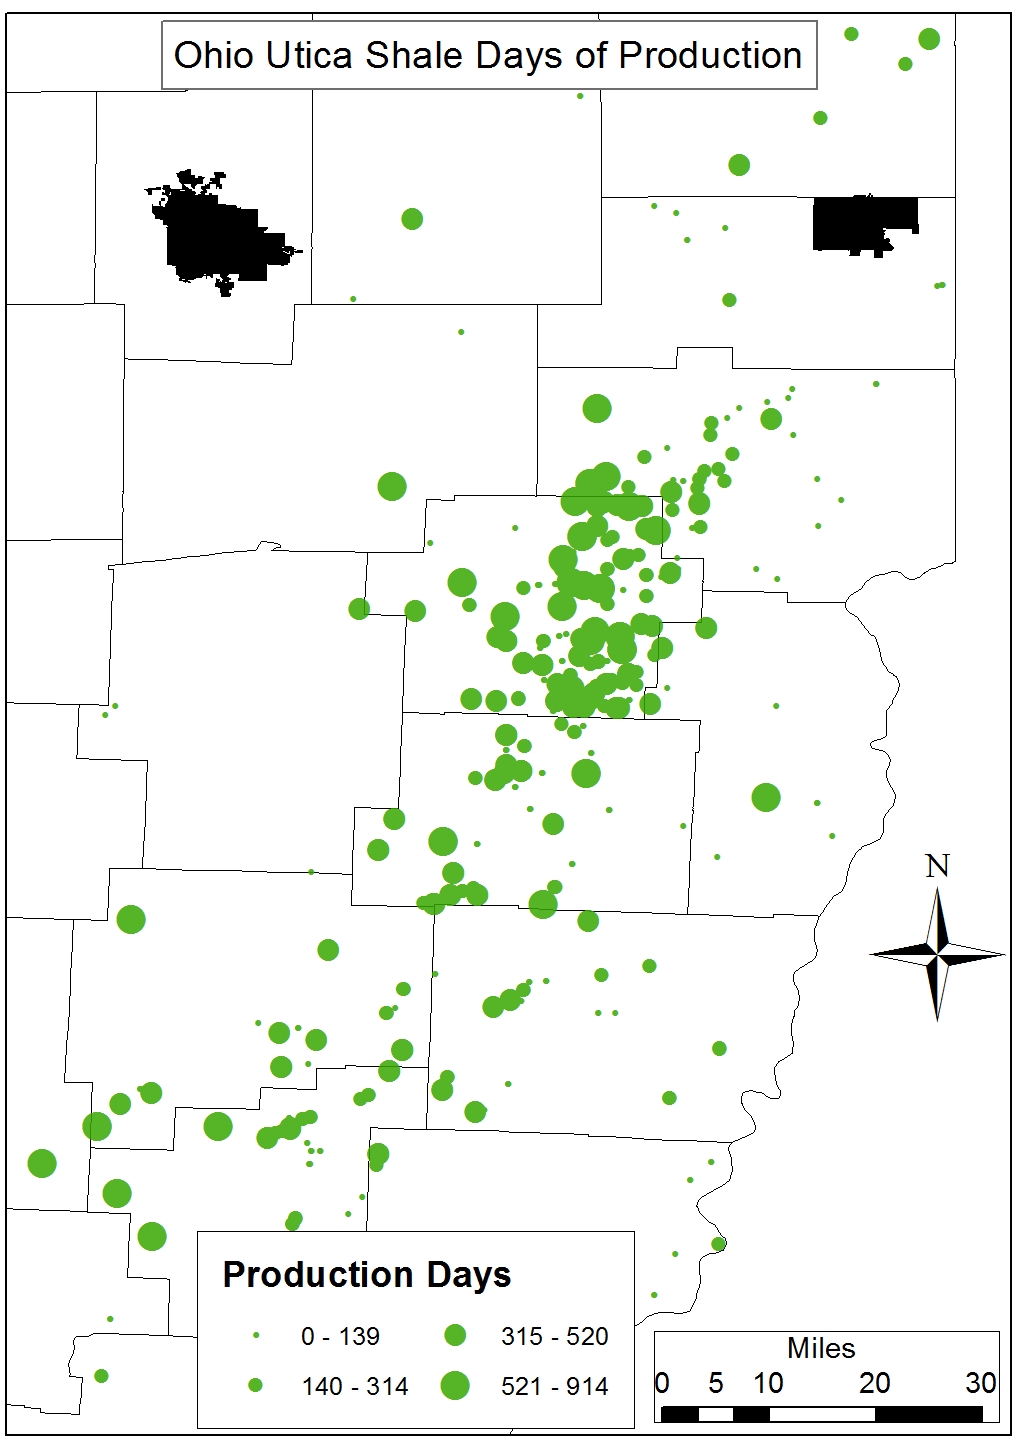
Fig 4a. Ohio Utica Shale Total Production Days, 2011-2014
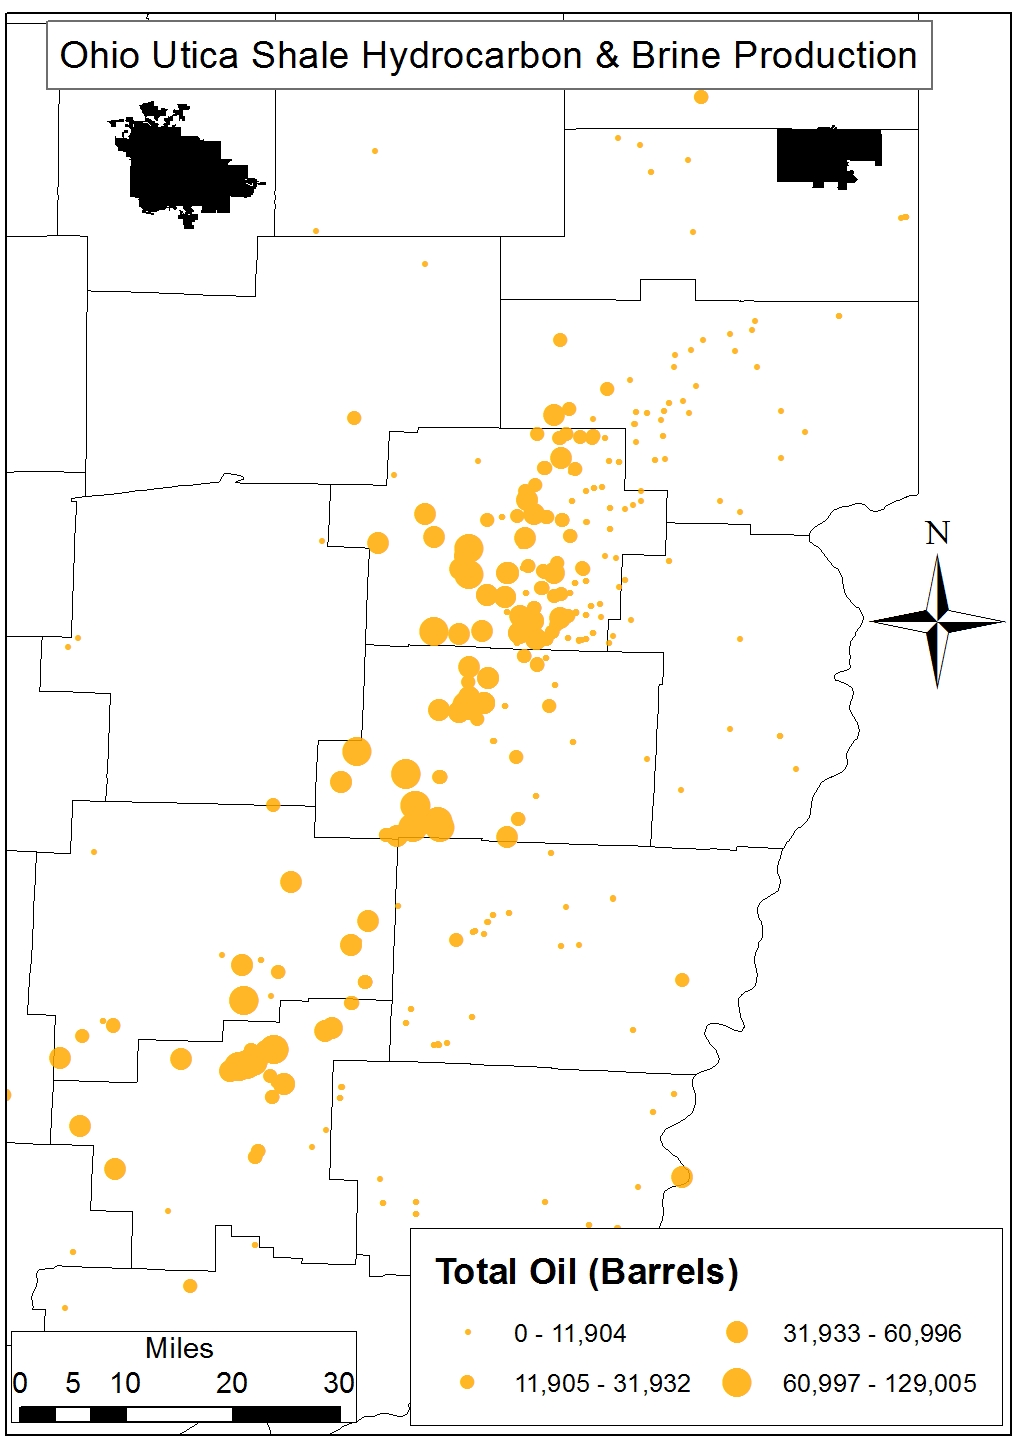
Fig 4b. Ohio Utica Shale Total Oil Production (Barrels), 2011-2014
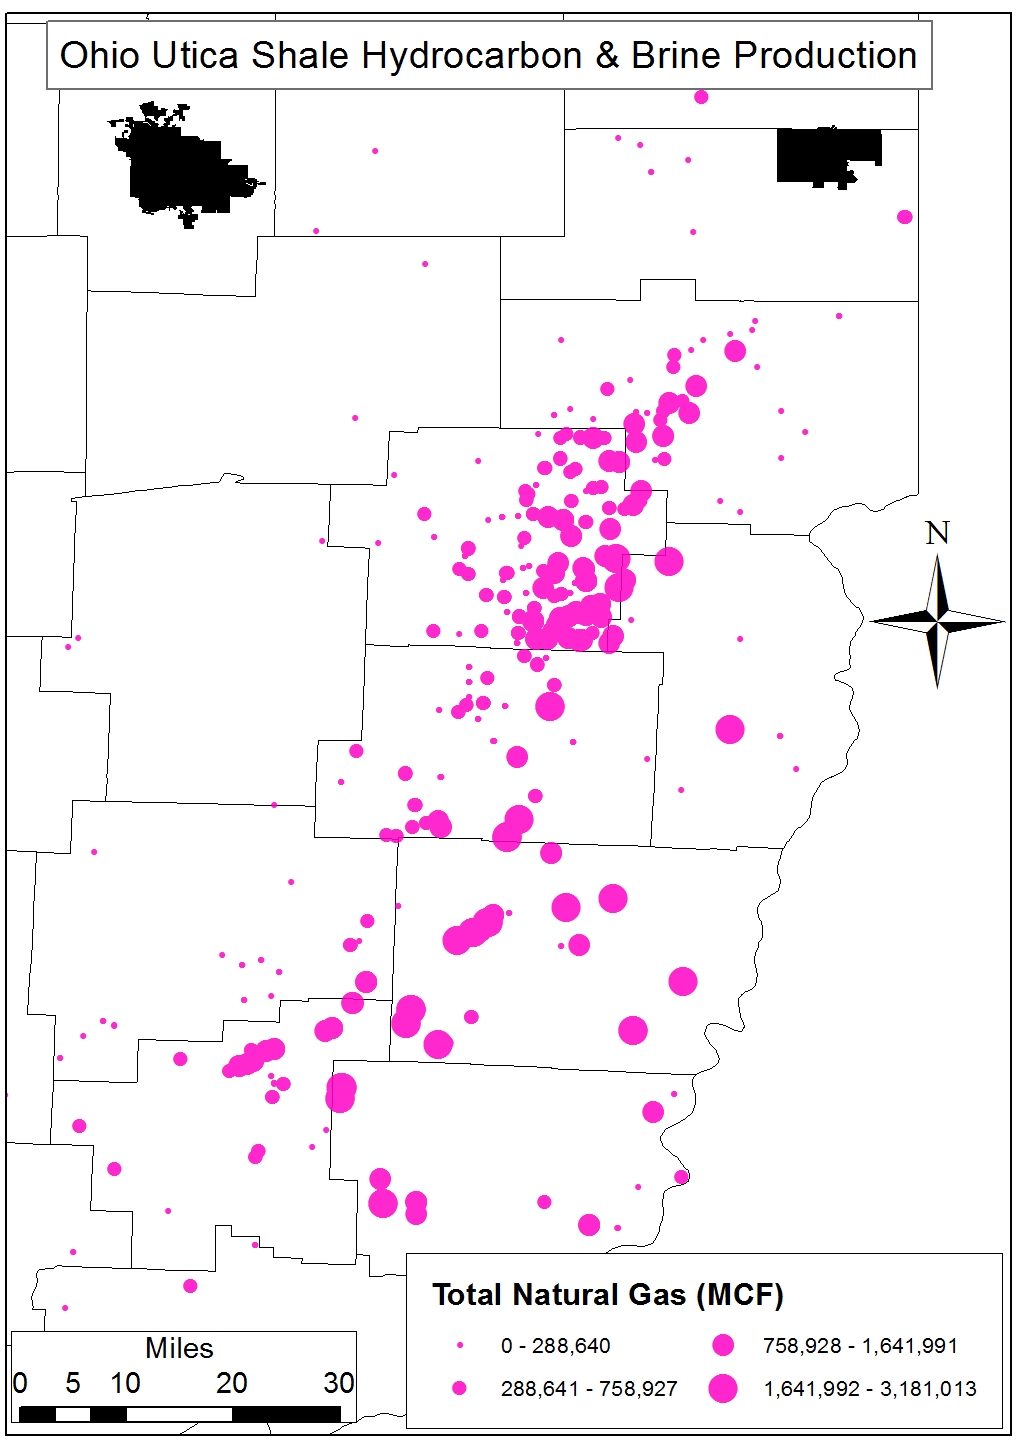
Fig 4c. Ohio Utica Shale Total Natural Gas Production (MCF), 2011-2014
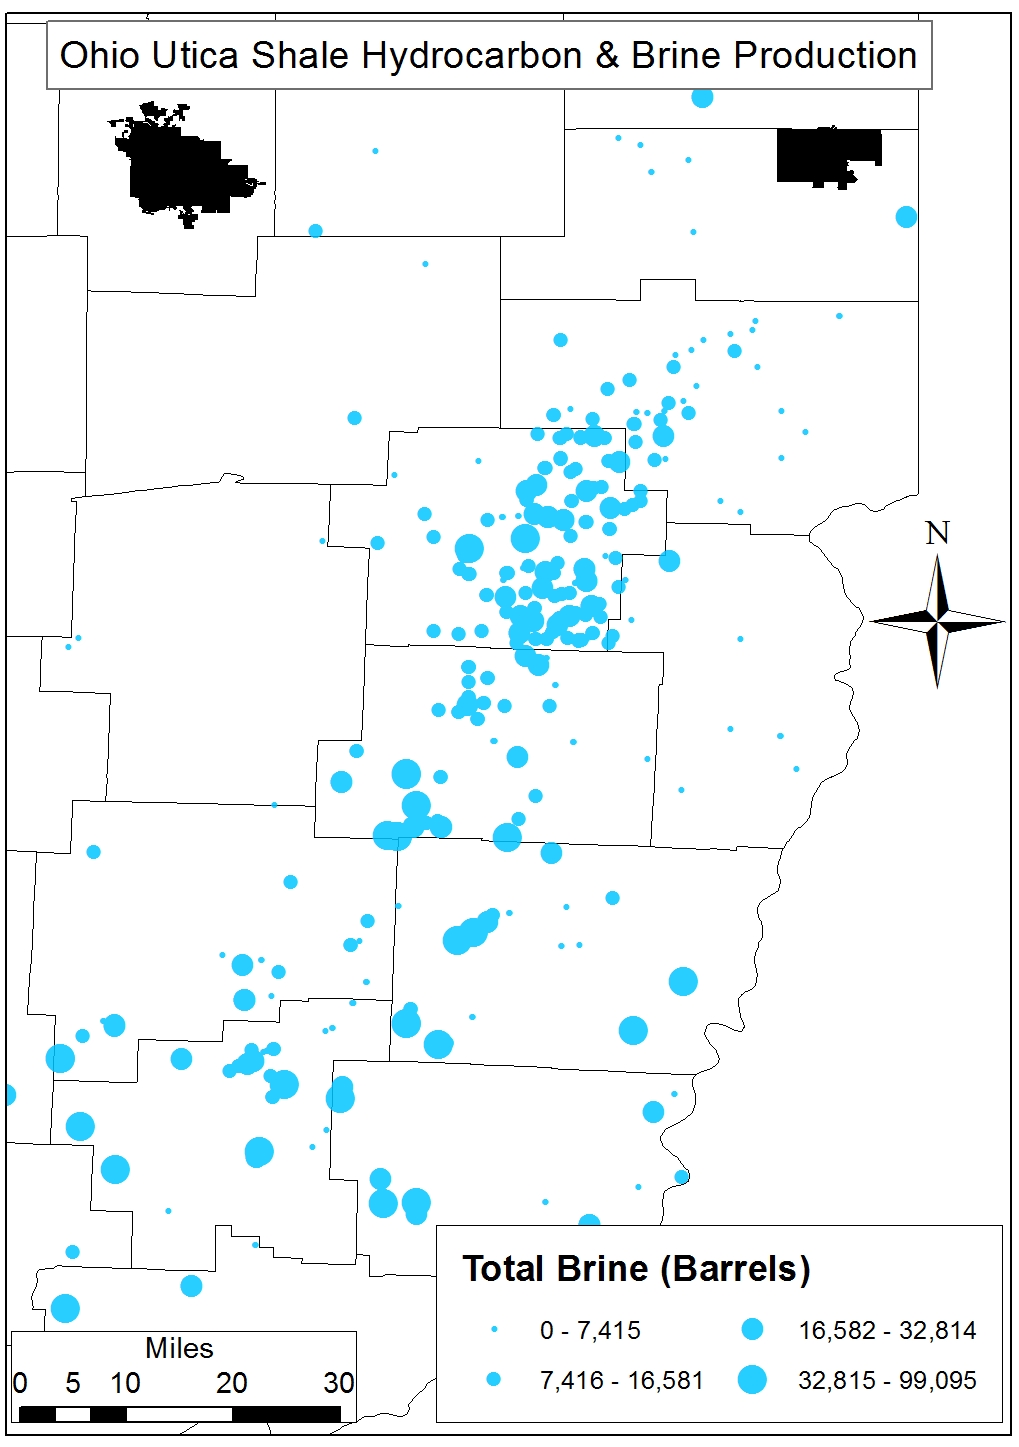
Fig 4d. Ohio Utica Shale Total Brine Production (Barrels), 2011-2014
Figures 5a-d. Histograms and Spatial distribution of OH Utica Shale total hydrochloric acid (HCl, gallons) and silica sand (tons) demands.
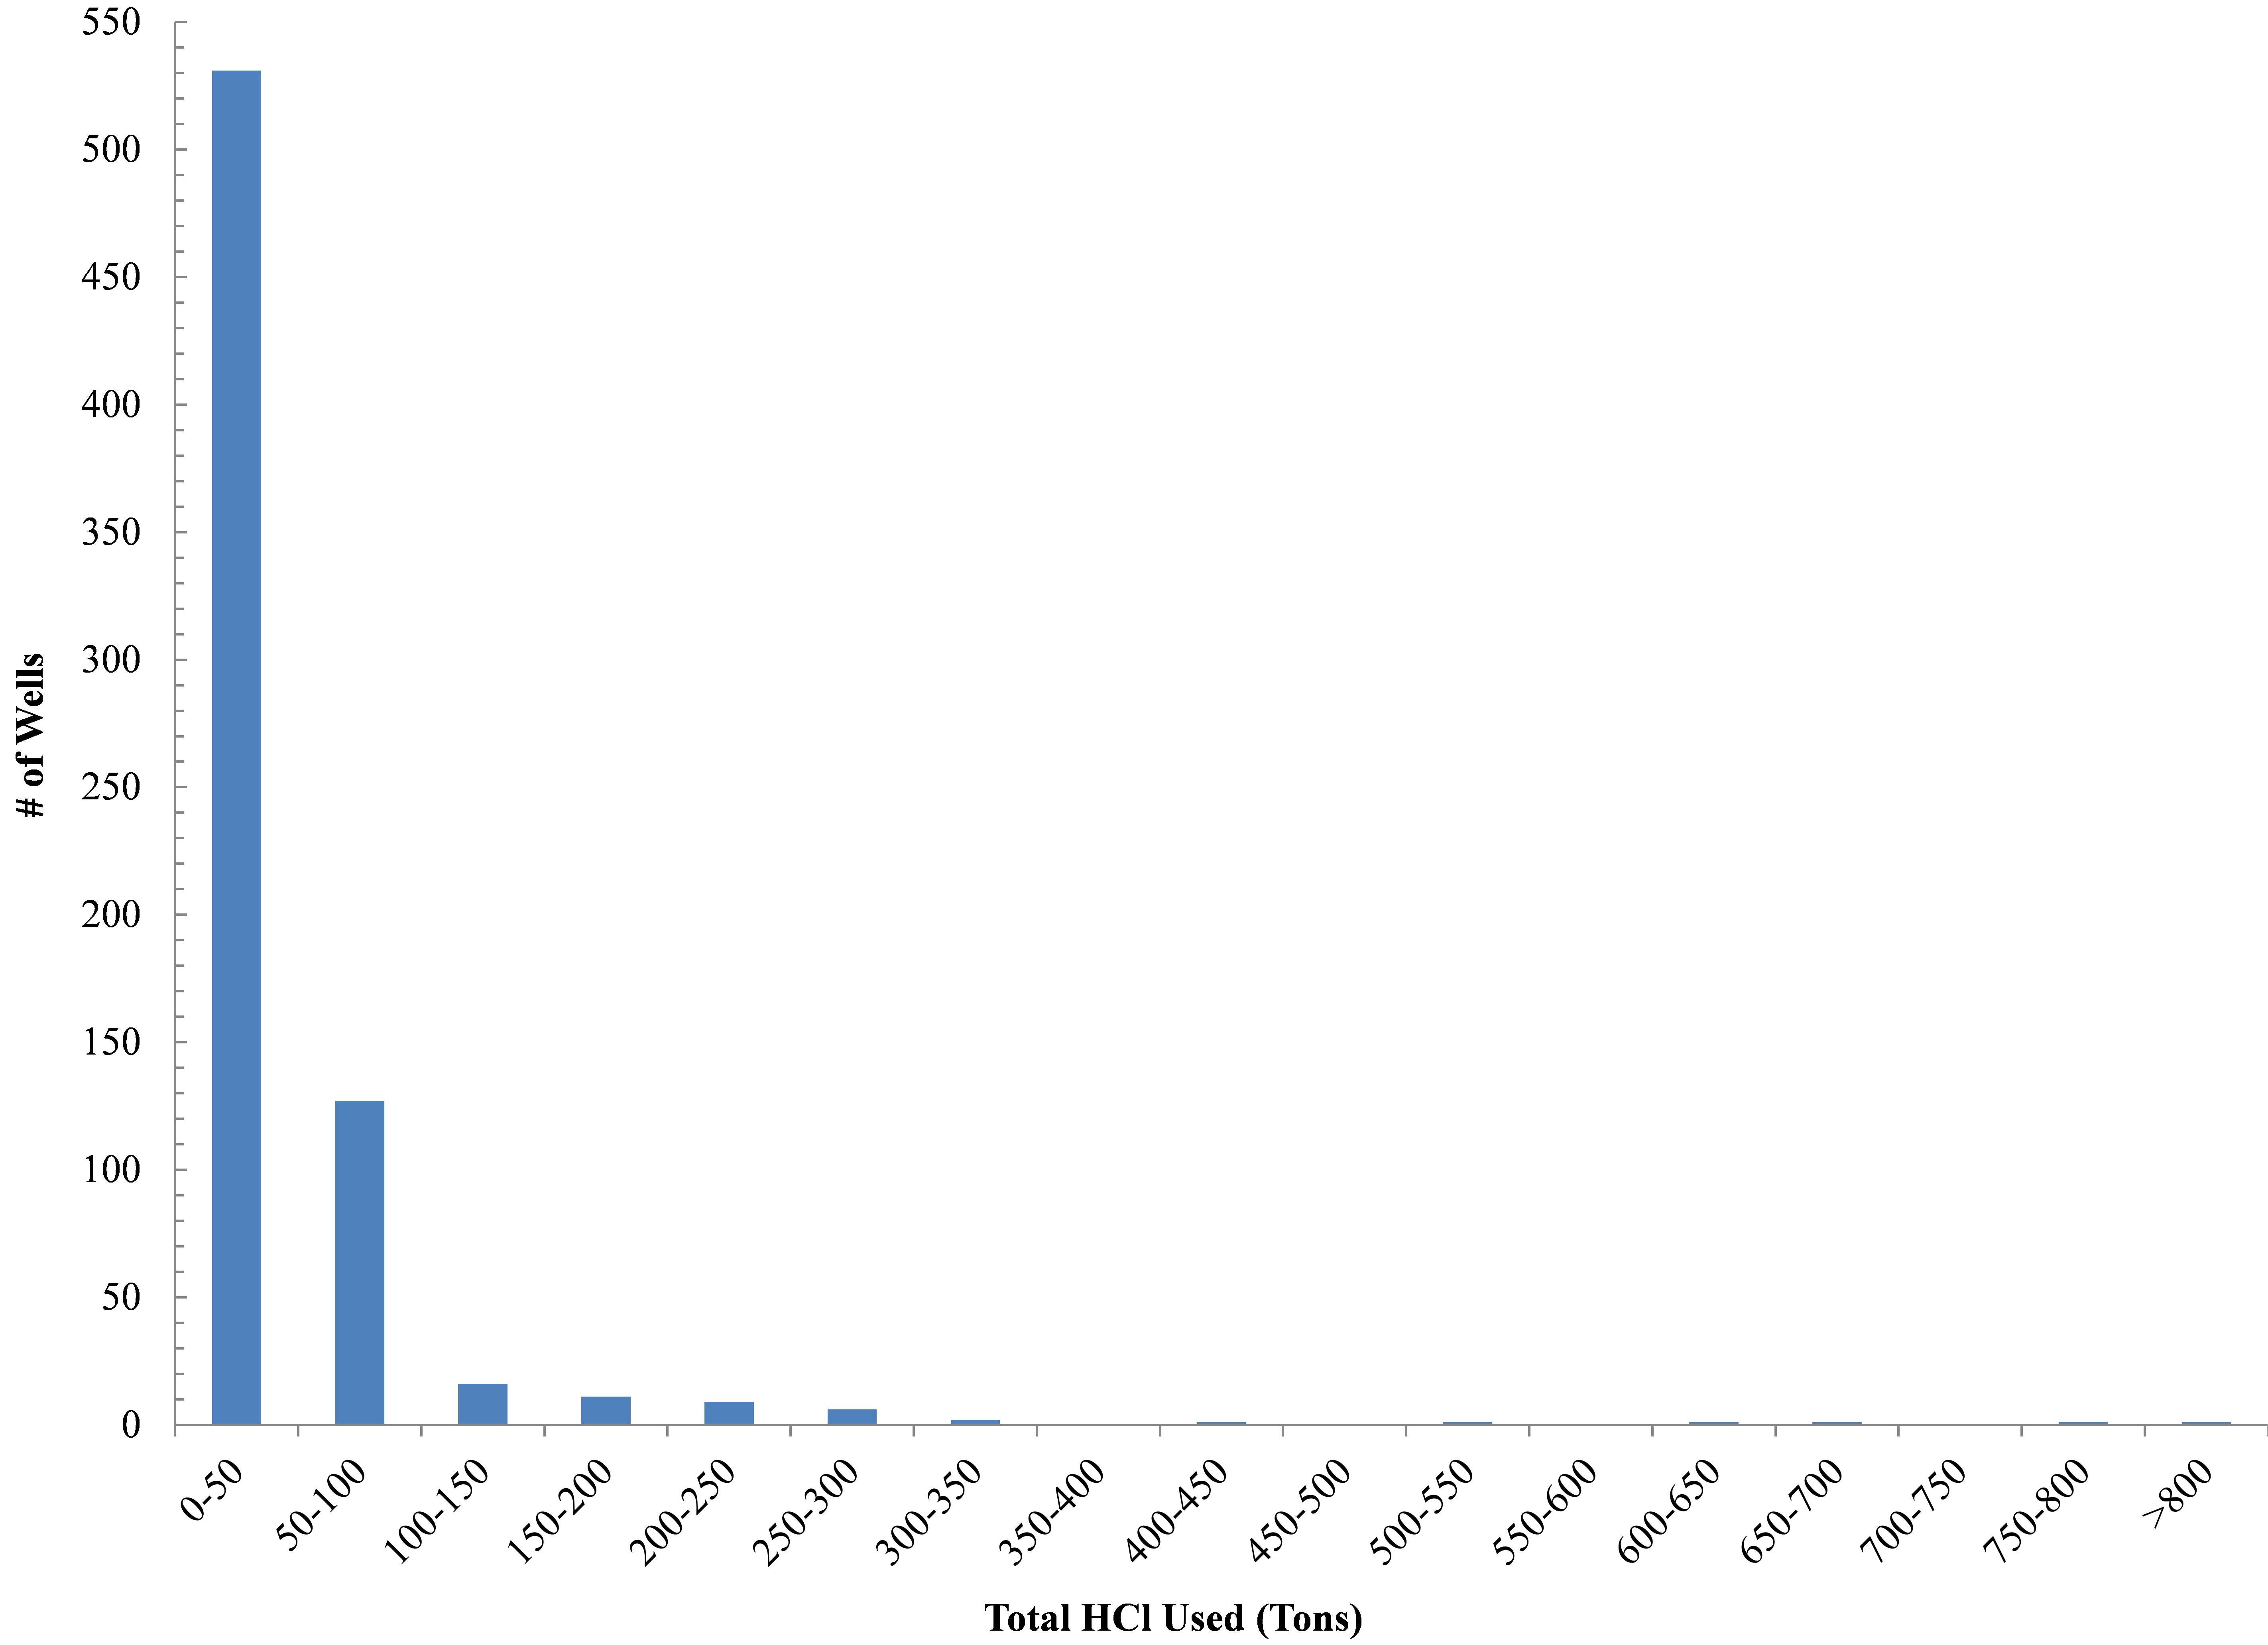
Fig 5a. Histogram of OH Utica Shale total Hydrochloric Acid (HCl, gallons)
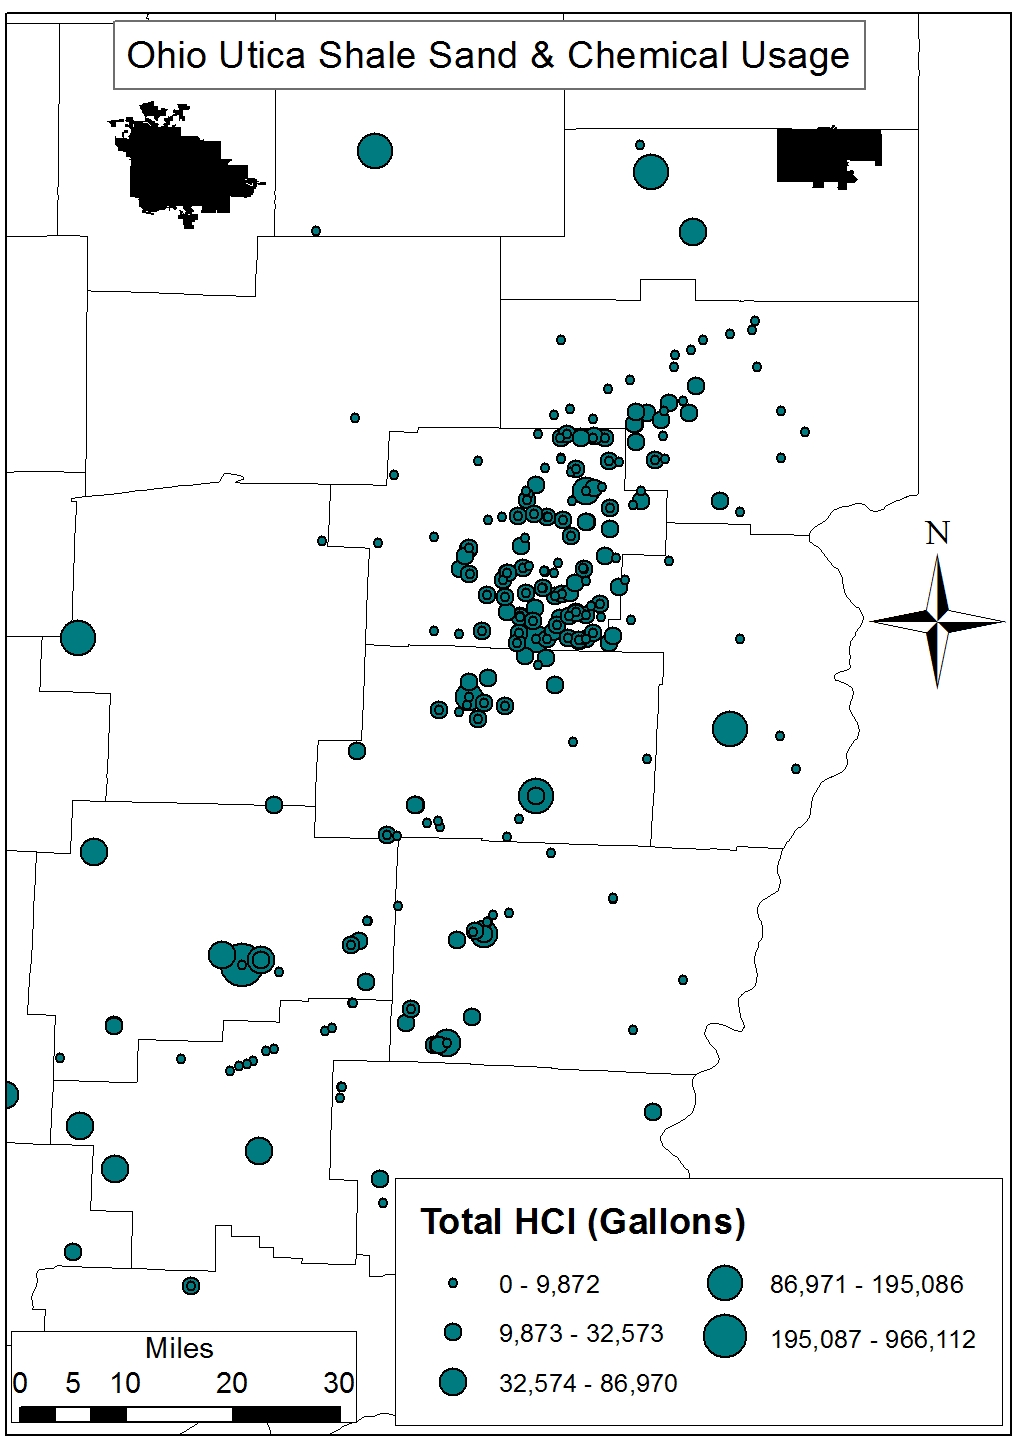
Fig 5b. Spatial distribution of OH Utica Shale total Hydrochloric Acid (HCl, gallons)
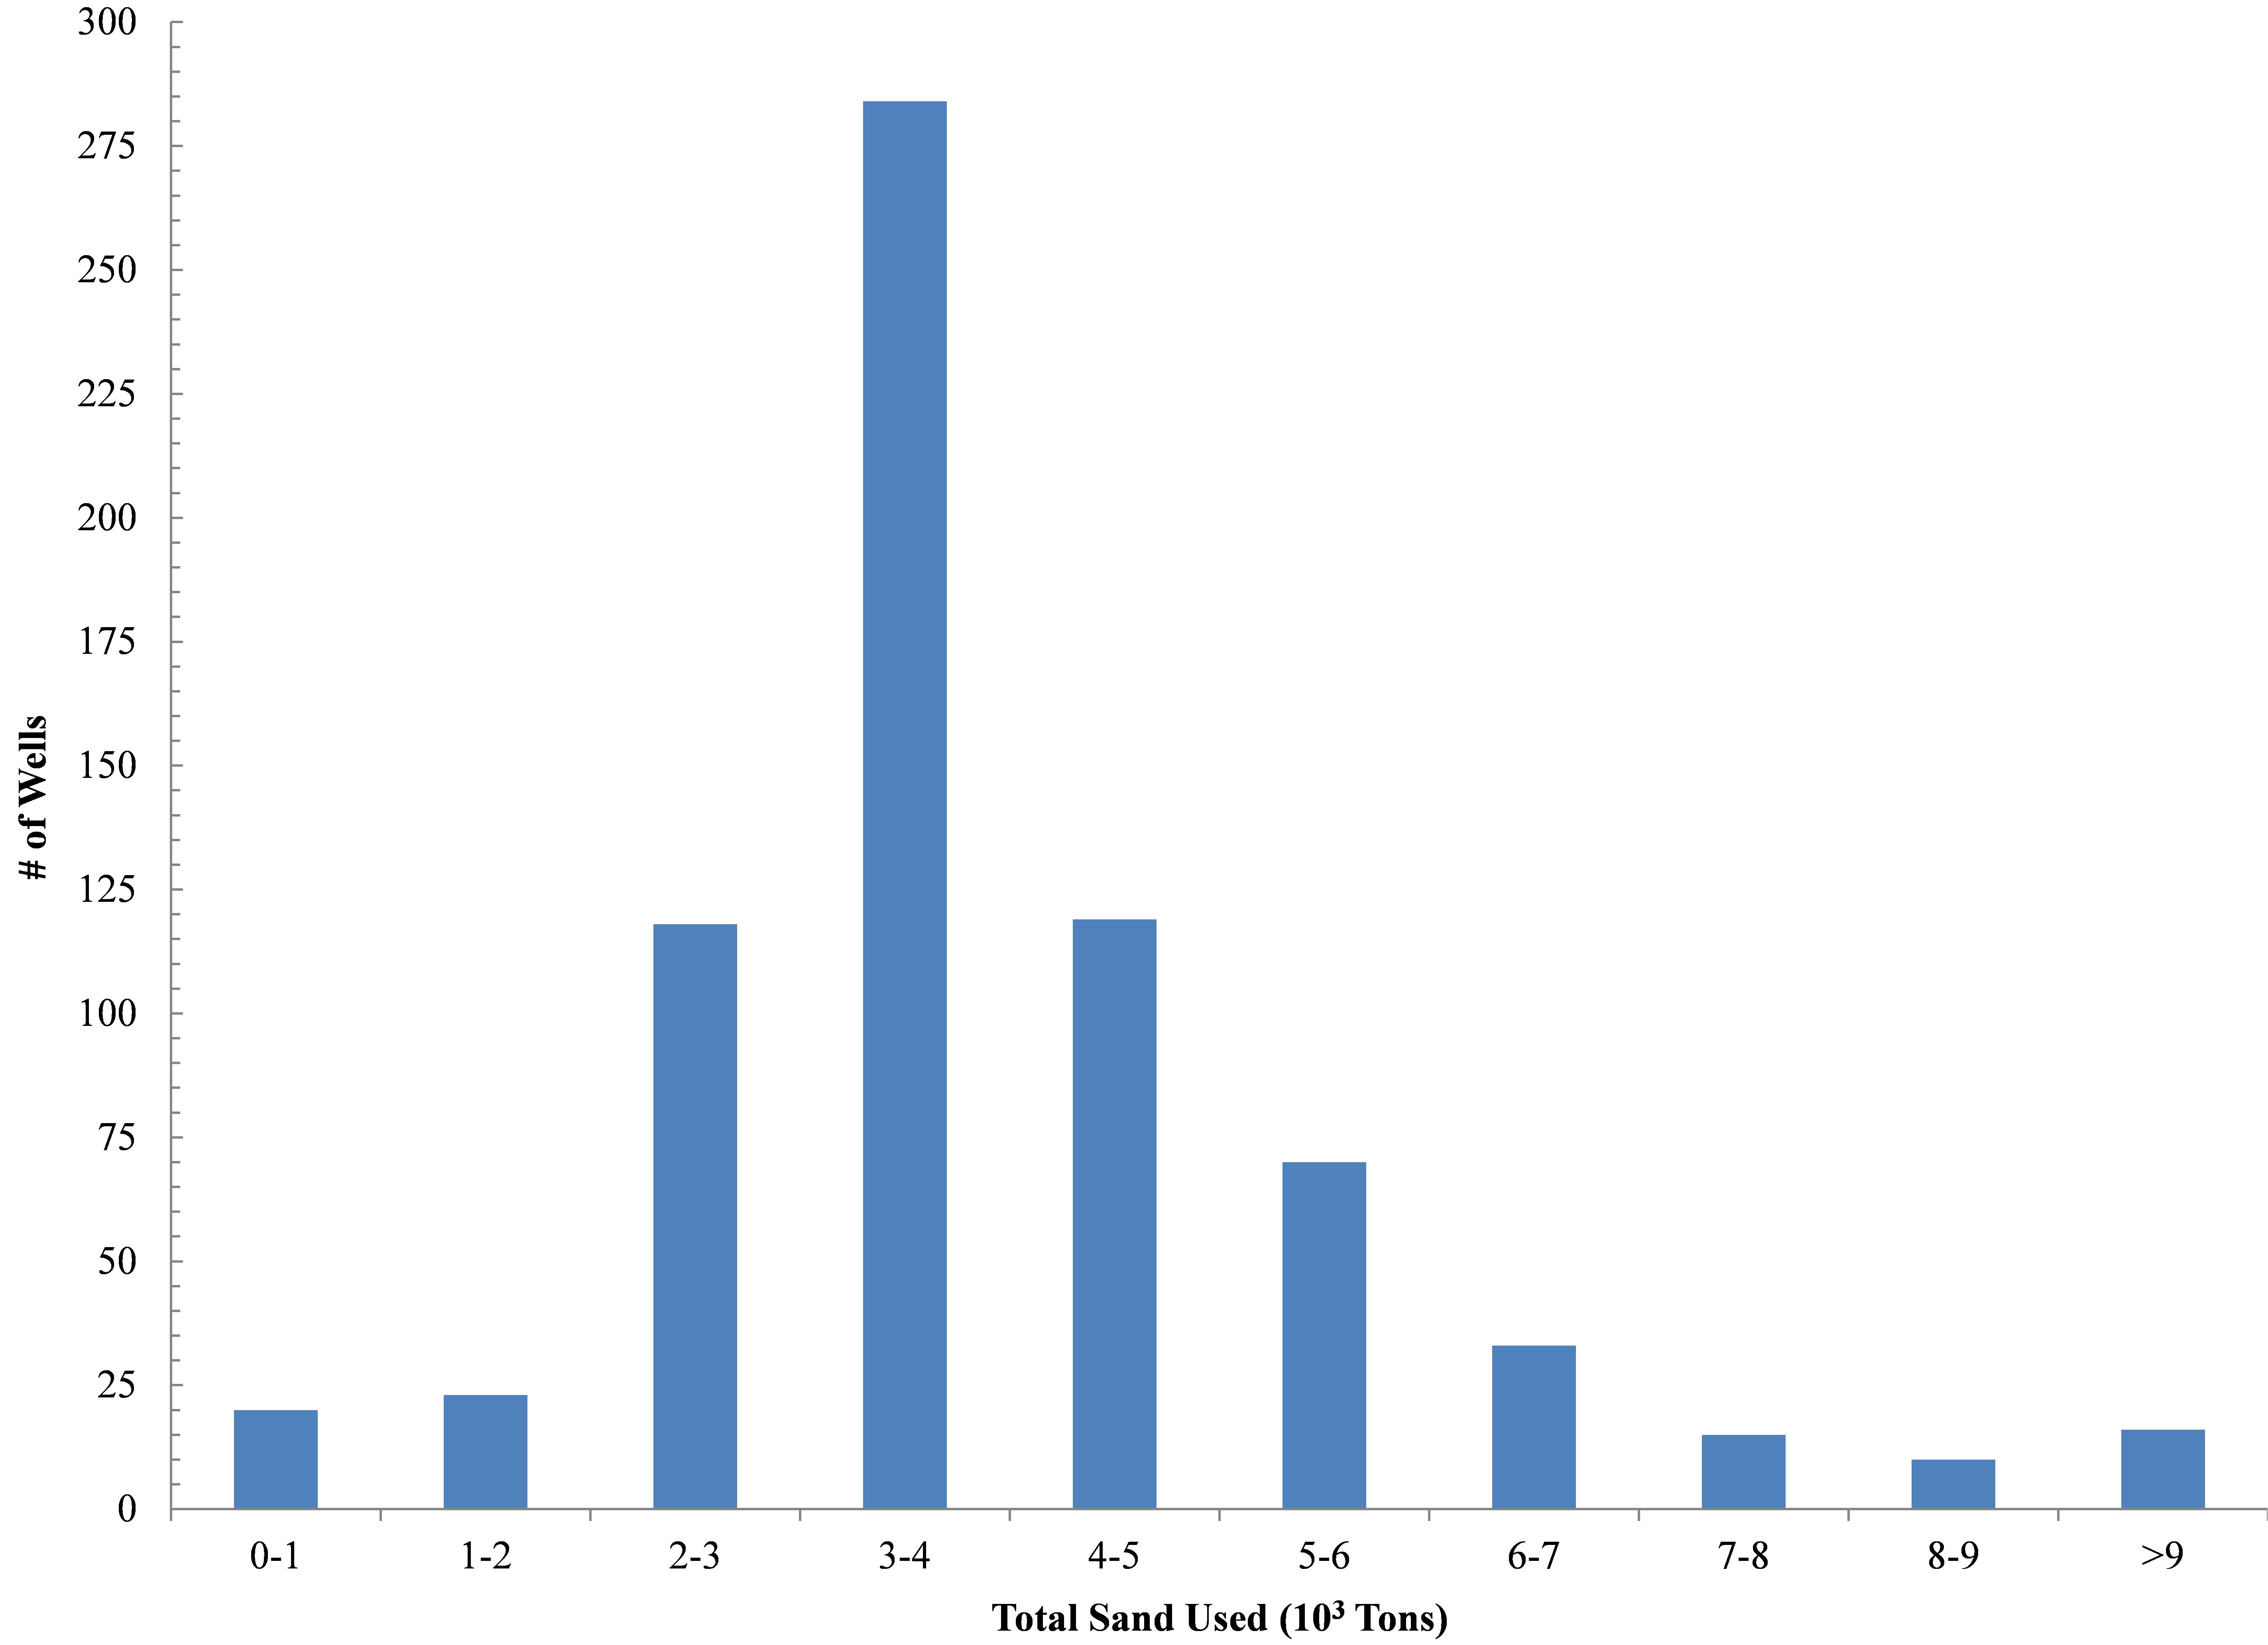
Fig 5c. Histogram of OH Utica Shale total Silica Sand (10^3 Tons)
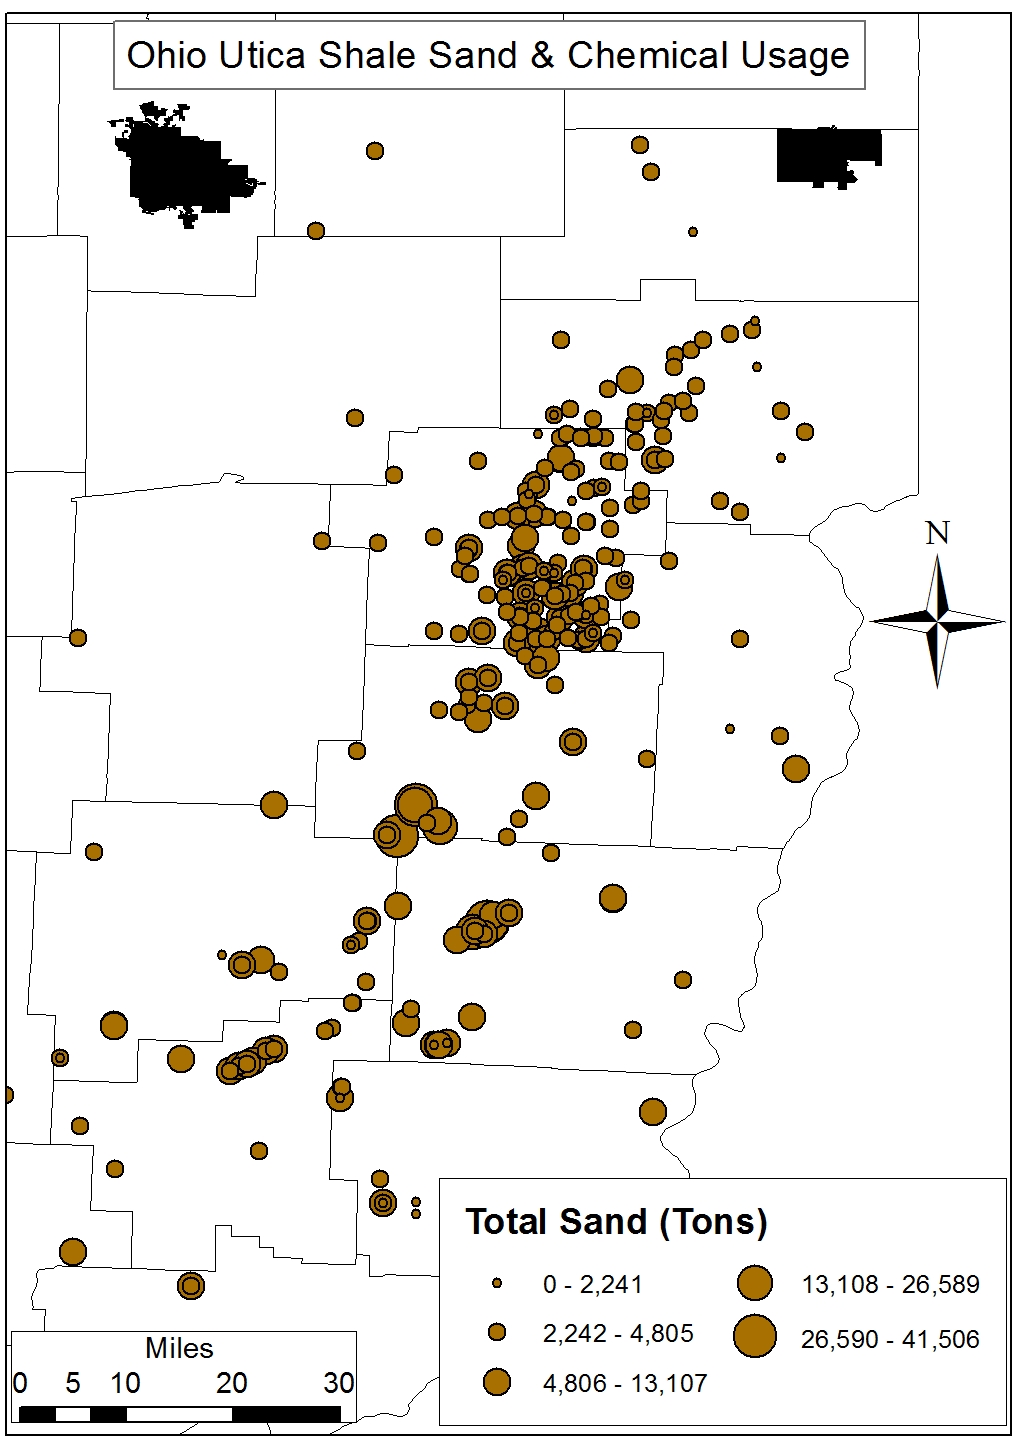
Fig 5d. Spatial distribution of OH Utica Shale total Silica Sand (Tons)
Figures 6a-b. Histograms and Spatial distribution of OH Utica Shale total resource utilization in terms of pounds per lateral.
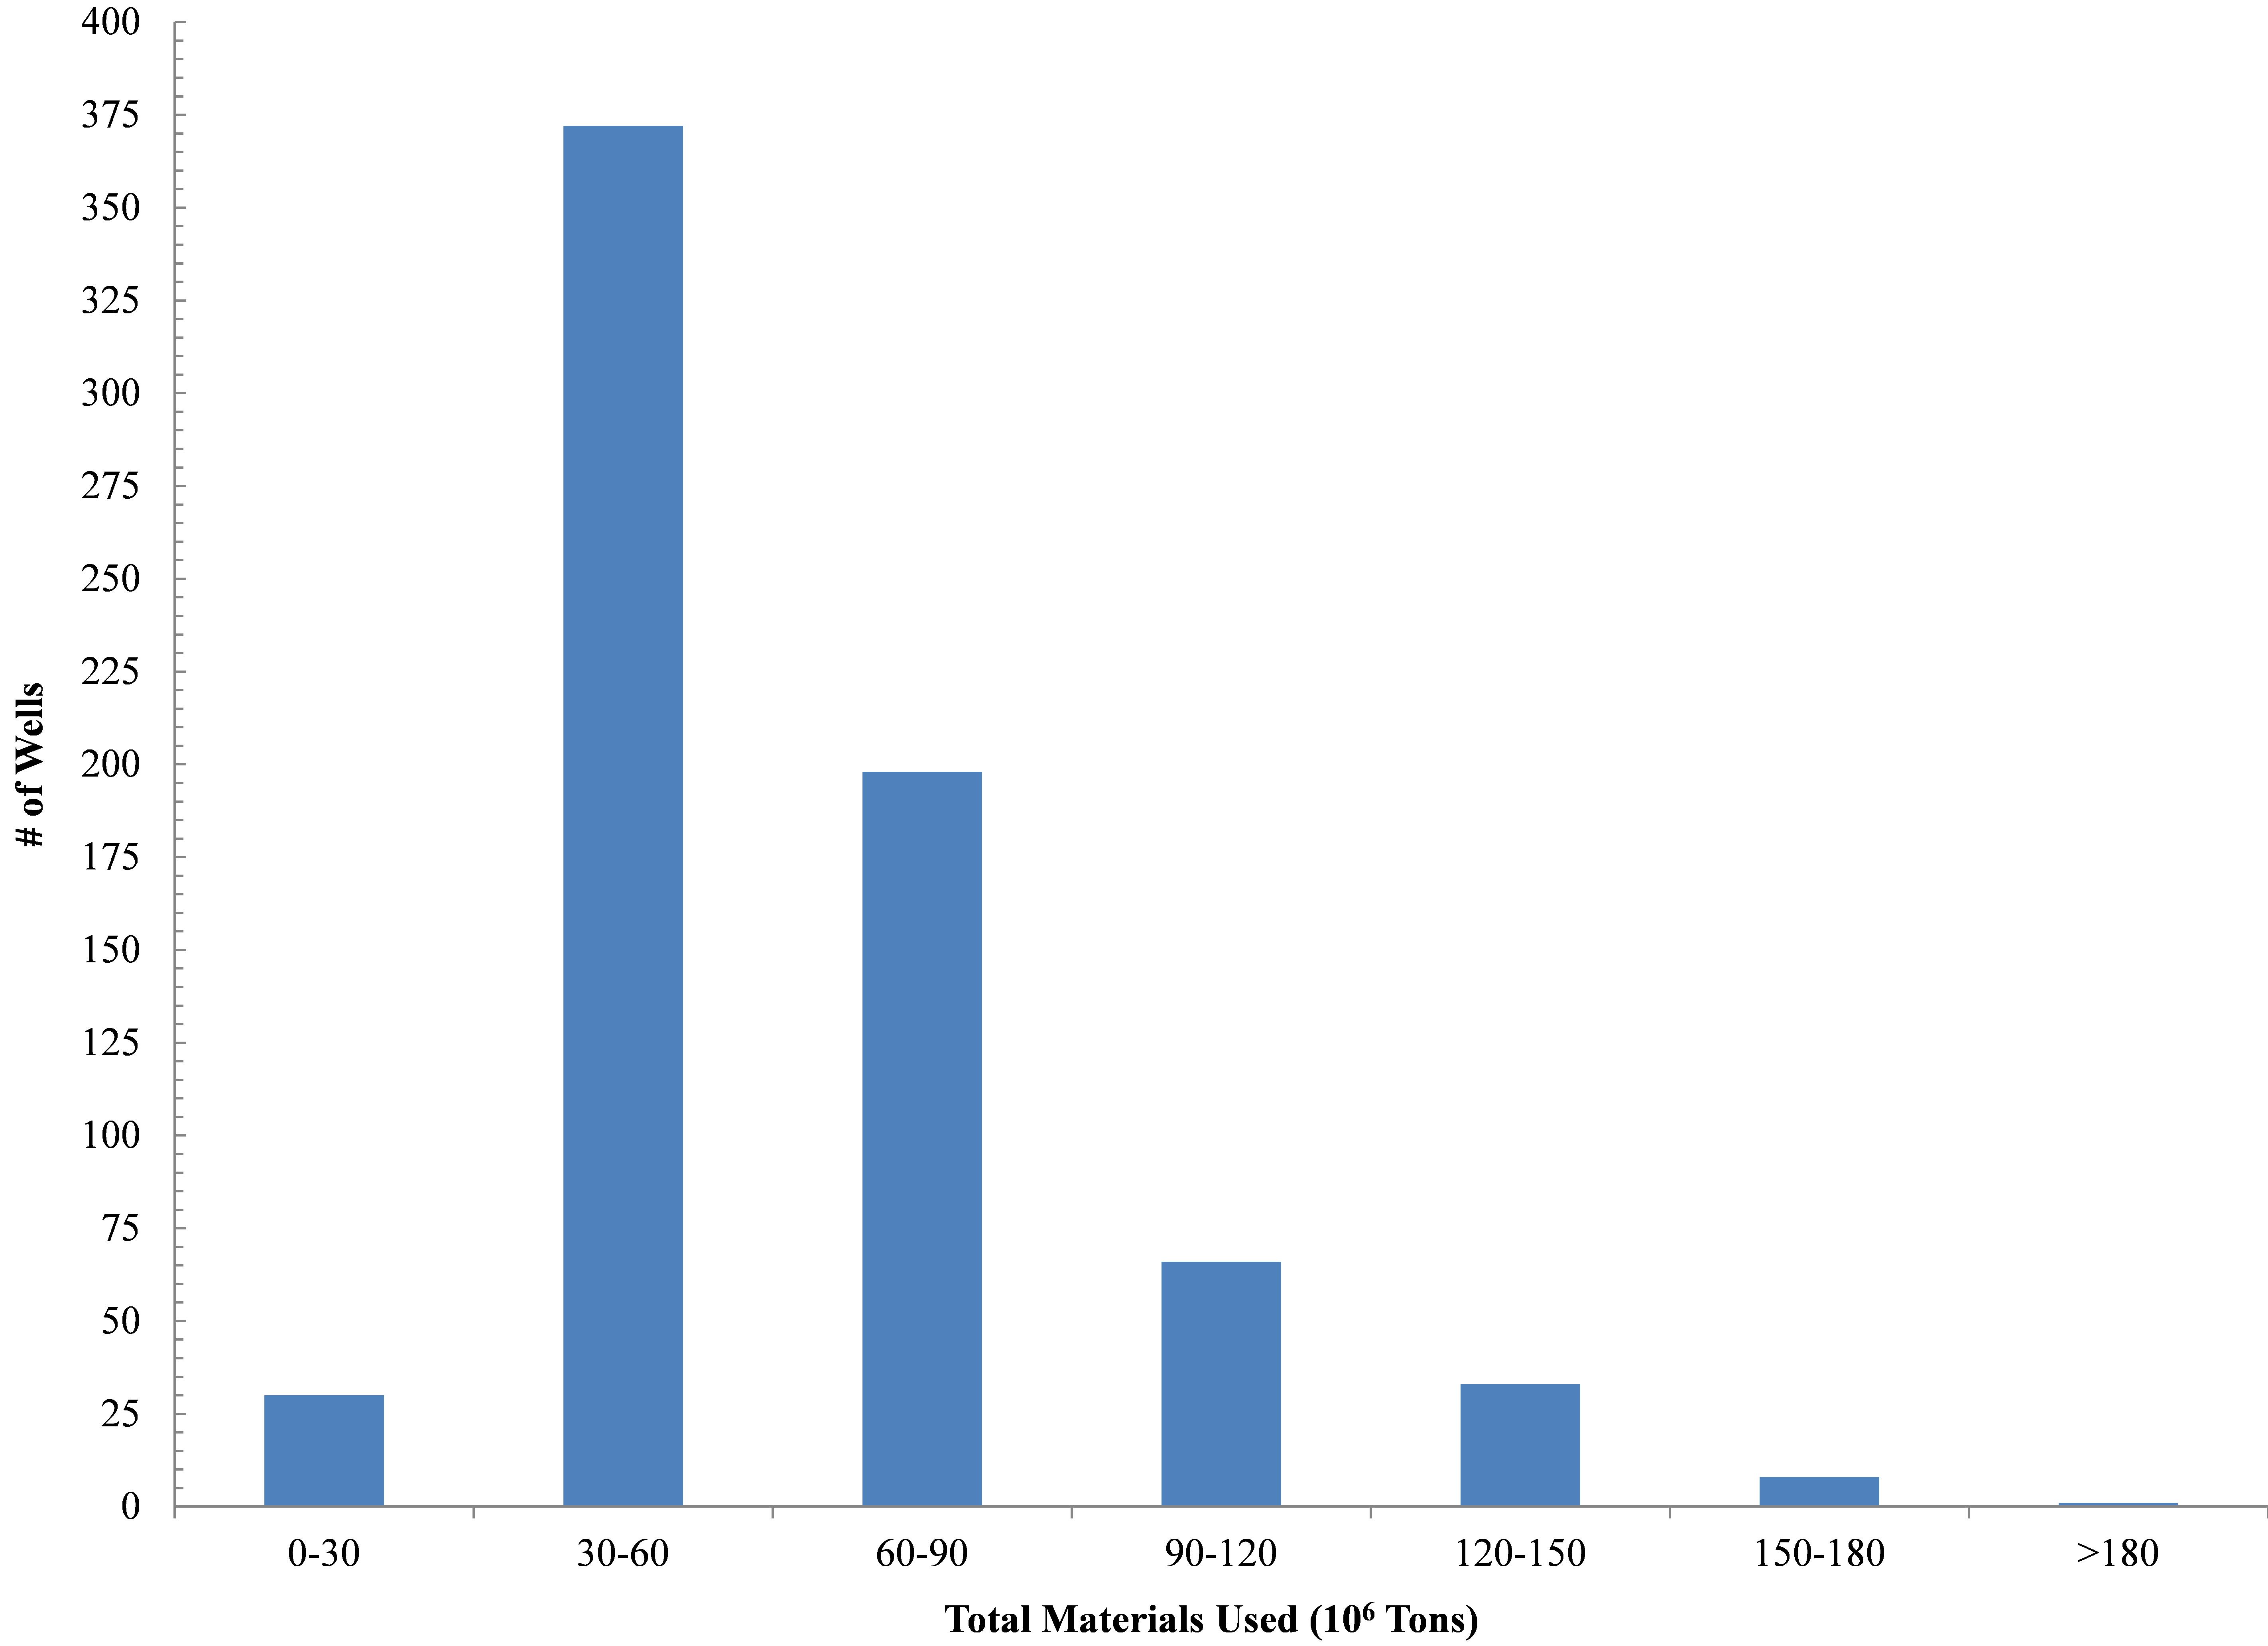
Fig 6a. Histogram of OH Utica Shale total materials used (10^6 Pounds)
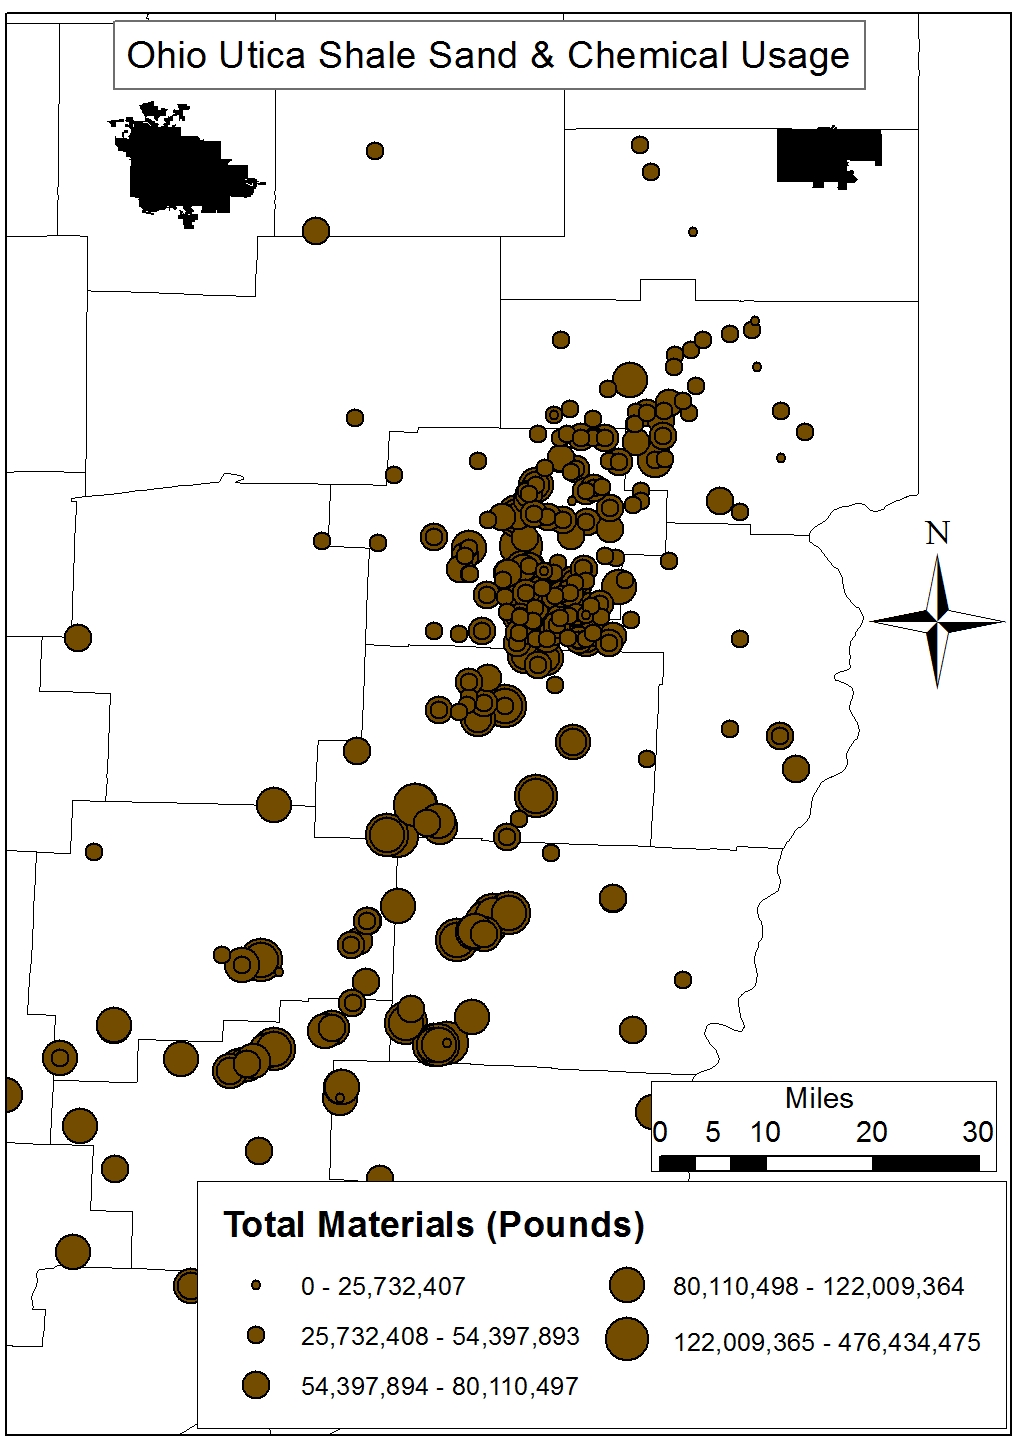
Fig 6b. Spatial distribution of OH Utica Shale total materials used (Pounds)
Endnote
1. Additionally, all of Carroll County’s permitted wells lie within the already – and increasingly so – stressed Muskingum River Watershed (MRW) which has been a significant source of freshwater for the shale gas industry courtesy of the novel pricing schemes of its managing body the Muskingum Watershed Conservancy District (MWCD) (Figure 1). Carroll laterals are requiring 5.41 million gallons per lateral Vs the state average of 6.58 million gallons per lateral.
Excellent analysis–Carroll County numbers are excellent and may be better than portrayed. It is true the drilling trend is moving south but well production comparisons are difficult because the older the wells in a given area level off with annual production a fraction of earlier years. An ongoing analysis charting daily and cumulative production would be very valuable to all concerned.
Phil McFarren