California Governor Gavin Newsom looks at surface expression oil spills

Governor Newsom Must Do More to Address the Cause of Oil Spill Surface Expressions

Chevron and other oil and gas companies in western Kern County have drilled so many oil and gas wells that they have essentially turned this area of California into a block of Swiss cheese. As a result, several of the most over-developed oil fields (in the world!) are suffering from gushing oil seeps known as surface expressions. Since May of 2019, one surface expression alone has spilled over 1.3 million gallons of oil and wastewater in the Cymric Field in southwestern California. Thirteen known surface expressions have been reported actively flowing in the Cymric field in 2019, one for over 15 years (GS5).

Regulators and Governor Newsom’s administration have attempted to address the issue but their response is not enough. Chevron was fined $2.7 million and Governor Newsom personally told Chevron to stop this spill, the location of which is shown below on the map in Figure 1. Oil and gas companies have also been ordered to lower their maximum injection pressures on new wells, limiting a technique called high pressure steam injection. Yet the state has continued to permit new cyclic steam and steam injection wells, the main cause of the surface expressions, including many in the same fields as the active surface expressions. Furthermore, data on new permit applications shows that Chevron and other operators intend to continue expanding their already bloated well counts. These new wells will increase the flow of oil to the surface via the over-abundance of existing older wells that serve as man-made pathways for toxic fluids.

Although Governor Newsom has made positive steps by halting new permits for higher pressure injections, the moratorium’s focus on injection pressure does not address all of the root causes of this epidemic of surface expressions, including over-development of these oil fields. Reducing the maximum injection pressures without also addressing the growing number of injection wells does nothing to reduce the pathways oil uses to travel to the surface. The Governor can reduce the active expressions and limit the risk for future expressions by halting permits for all new oil and gas wells, banning the existing use of steam injection, and forcing oil companies to plug and properly abandon older wells before they fail.

(To see Governor Newsom’s track record on permitting new oil and gas wells, see FracTracker Alliance’s collaboration with Consumer Watchdog at NewsomWellWatch.com)

View map fullscreen | How FracTracker maps work

Figure 1. Map of 2018-2019 Cymric Oil Field Surface Expressions. The map includes the locations of surface expressions as well as the locations of new injections wells permitted in 2019 and current applications submitted since November 19, 2019.

Background

Steam injection is used more commonly in California than hydraulic fracturing, due to the nature of California’s abundant geological activity. Steam injection wells include wells devoted solely to injection and others, called cyclic steam wells, that alternate between injection of steam and production of oil and gas. It requires an extreme amount of energy to accomplish this, so they are considered energy intensive. These operations are known collectively as enhanced oil recovery (EOR) wells.

Steam injection wells increase the volume of oil produced when compared to conventional methods. They do this by injecting steam and water into the low-quality heavy crude produced in California in order to decrease the viscosity and push it towards the bottom holes of the production wells. The steam also pushes oil in other directions unintentionally, such as to the surface where it can spill out becoming a surface expression.

Some of the most notable negative impacts caused by EOR wells in California include greenhouse gas contributions, air and water contamination, and risks to workers.

Environmental Impacts

In addition to the creation of greenhouse gases from burning the fossil fuels extracted from California oil fields, oil and gas operators cause surface expressions and emit methane and other greenhouse gases as they leak out of the ground. The leaking natural gas is full of toxic and carcinogenic volatile organic compounds that degrade the local and regional air quality and exacerbate climate change. The majority of these expressions have not been documented by regulators and the emissions are not considered. The expressions also push oil and wastewater upwards through groundwater, leaving it contaminated. When the oil gets to the surface, it destroys terrestrial habitat for native plants and endangered species such as the long nosed leopard lizard. The seeps are also a major hazard to migratory birds that confuse the pooling oil for water sources.

Worker Safety

Surface expressions do not just ooze oil. When the pressure spreads underground beyond the target formation, it can cause oil, water, steam, rocks, and natural gas to shoot from the ground, presenting a deadly hazard to worker safety. Stories from oil field workers describe periods when oil companies increase steam injection volumes and activity as bringing chaos to the oil fields. “Engineers across the region engaged in a high-stakes version of whack-a-mole, rushing to plug one geyser while others broke through elsewhere,” according to Julie Cart with the LA Times.

A construction supervisor for Chevron named David Taylor was killed by such an event in the Midway-Sunset oil field near Bakersfield, CA. According to the LA Times, Chevron had been trying to control the pressure at the well-site. The company had stopped injections near the well, but neighboring operators continued injections into the pool. As a result, migration pathways along old wells allowed formation fluids to saturate the Earth just under the well-site. Tragically, Taylor fell into a 10-foot diameter crater of 190° fluid and hydrogen sulfide.

High Pressure Steaming

The practice of high pressure steam injection is incredibly similar to hydraulic fracturing, but unfortunately is not regulated under the current rules established by State Bill 4 (SB4). The technique is used to stimulate increased production from “unconventional” target formations such as the Monterey Shale. Steam is injected at high pressures, fracturing shale and other sedimentary rocks. High pressure steam injection both opens new pathways in the source rock and decreases the viscosity of heavy crude, allowing crude to flow more easily to the borehole of the well.

In 2016, the oil and gas industry was able to introduce an exemption in the regulations to allow for the stimulation of wells without an SB4 permit, as long as it was using steam, even when the injection pressure was greater than the fracture gradient of the target formation. For the last three years the practice existed in a legal grey area without any oversight. Then, in July of 2019, Governor Newsom’s administration adopted new underground injection control regulations, which explicitly allowed steam injection at pressures above the fracture gradient of the formation (1724.10.3. Maximum Allowable Surface Injection Pressure). That means operators were essentially “fracking”, but using steam to fracture the targeted shale formation instead of water (hydraulic). With the formal approval of the practice, operators ramped up operations resulting in numerous new surface expressions forming and the flow rates of existing surface expressions increasing.

Governor Newsom’s Response

On November 19, 2019, California Governor Gavin Newsom released a press statement outlining the work his administration is planning to address issues with oil and gas drilling such as surface expressions. Along with two other strategies, the Governor called for an immediate end to high pressure cyclic steaming. This new ban was meant to stop the existing surface expressions in oil fields, and prevent any new ones. Unfortunately, the activities of Chevron and the other operators in these fields are likely to prevent the Governor’s intervention from having the intended impact. These operators are planning to drill many new injection wells in close proximity to the surface expressions, in effect increasing the flow of current surface expressions and increasing the risk of more in the future. From the time of the press release to the end of 2019, oil and gas operators applied for permits authorizing 184 new steam injection wells. The majority of these permits are in the same fields as the surface expressions.

Injection Pressure

The oil and gas industry has blamed the surface expressions entirely on the geology of the oil fields in the southwestern region of Kern, specifically on the brittle diatomite crust that lies above many of Central California’s oil formations. The thing is, diatomite is common throughout the Monterey Shale. In fact, the entire Monterey formation of the Santa Barbara-Ventura coast generally consists of an upper siliceous member (diatomaceous) (Stanford, 2013; Issacs 1981). The risk is not unique to just the Cymric, McKittrick and Midway-Sunset Fields, yet these three fields, along with the Lost Hills field to the north, have the highest counts of reported surface expressions, as shown in the map below in Figure 2.

View map fullscreen | How FracTracker maps work

Figure 2. Map of California well density and surface expressions. The map visualizes California Department of Conservation (CA DOC) data summing surface expressions by oil field. Locations of new injections permit applications submitted since November 19, 2019 are also shown, summed by section.


These fields also have the highest concentration of wells in the state. Surface expressions in the oil fields of western Kern County provide a warning for the rest of the state. Over-development of an oil field is a major contributor to the potential for surface expressions. In the case of the Cymric field, there are simply too many wells drilled in a limited area. This is the reason Chevron shut down injection wells within 1,000’ of the surface expression, but even then the seep did not stop.

The map in Figure 2 shows that the Cymric field has the highest density of active and abandoned oil and gas wells in the state, providing plenty of man-made pathways to the surface. Our analysis shows that there are at least 319 reported wells drilled within 1,000’ of the 1Y surface expression. Another 154 wells are drilled within 1,000’ of the GS5 expression that has been actively flowing since 2003, including 11 active steam injection wells.

Wells in the Cymric field have been drilled in such numbers and in such close proximity that downhole communication between the wells is unavoidable. “Downhole communication” occurs when wells drilled in close proximity leak oil, natural gas and other formation materials between boreholes. This is a dangerous situation, for public health and worker safety. Downhole communication with unknown and known abandoned wells with brittle casings or active wells with poorly engineered casing that shear could even “blow sky high.”

To understand the spatial distribution of oil and gas wells in California, FracTracker used GIS to conduct a hot spot analysis. The parameters included all oil and gas wells in the state of California using California Department of Conservation (CA DOC) data (updated 1/4/20). Results of the analysis are shown in the map in Figure 2. Areas where the analysis showed statistically significant clusters of wells in high density are shown in purple, from low levels of statistical significance to high. Of note, the region with the highest level of statistically significant well density is located along the western side of Kern County. It is in the very same localized area as the eight surface expressions in the Cymric field, and includes the Cymric, McKittrick, and north end of the Midway-Sunset fields.


FieldNew Steam Well Permit Count
Midway-Sunset427
Cymric197
Belridge, South150
Kern River125
McKittrick105
Coalinga88
Poso Creek71
San Ardo69
Kern Front43
Lost Hills20
Arroyo Grande15
Cat Canyon10
Edison5
Orcutt4
Placerita1
Grand Total1130

Table 1. Count of new steam well permits approved in 2019, by field. Data taken from CA DOC Weekly Summary of Permits Data (ftp://ftp.consrv.ca.gov/pub/oil/).


OperatorNew Steam Well Permit Count
Aera Energy LLC381
Chevron U.S.A Inc.360
Berry Petroleum Company, LLC276
Sentinel Peak Resources California LLC112
E & B Natural Resources Management Corporation65
Seneca Resources Management Corporation61
California Resources Production Corporation46
Vaquero Energy, Inc.10
Crimson Resource Management Corp.5
Naftex Operating Company5
Kern River Holdings, Inc.4
Santa Maria Energy, LLC4
Grand Total1329

Table 2. Count of new steam well permits approved in 2019, by operator. Data taken from CA DOC Weekly Summary of Permits Data (ftp://ftp.consrv.ca.gov/pub/oil/).

State’s Response

On November 19, 2019, California Governor Gavin Newsom released a press statement outlining his administration’s plan to address several issues with oil and gas drilling. Among them, the Governor called for an immediate moratorium on issuing new permits for “high pressure cyclic steaming.” This new moratorium was meant curb the rise of surface expressions. Unfortunately the activities of Chevron and the other operators in these fields are likely to undermine the Governor’s action. These operators are planning to drill many new injection wells in close proximity to the surface expressions, in effect increasing the flow of current surface expressions and increasing the risk of more in the future. From the time of the press release to the end of 2019, oil and gas operators applied for permits authorizing 184 new steam injection wells. The majority of these permits are in the same fields as the surface expressions. While the newly implemented moratorium will prevent future permits, permits issued prior to November 19, 2019 remain valid and will continue injecting at high pressure.

The regulatory agency, formerly DOGGR and now CalGEM, has already approved 1,330 new steam injection wells during Governor Newsom’s first year in office; 874 in the Cymric, McKrittrick, and Midway-Sunset fields alone where there are already over 9,300 operating. For summaries of new steam well permits approved in 2019 by field and operator, see Table 1 and 2 below. Even though Chevron stated that they ceased operations within 1,000 feet of the surface expressions (see map in Figure 1), 17 new steam injection wells have been permitted within 1,000 feet in 2019 alone. After the death of David Taylor in 2015, regulators established an 800’ safety buffer zone from that expression, but that safety measure has been ignored for more recent spills. Today, 27 steam injection wells continue to operate and three new permits are being considered within 800’ of the largest 2019 spill. Regulators are now considering permits for an additional 83 new steam injection wells in the same sections of the Cymric oil field closest to these recent surface expressions.

Conclusions and Recommendations

The state’s current solution for reducing surface expressions – a moratorium on high pressure steam injection – is not enough. Chevron and regulators say that it is unclear what exactly is causing the surface expressions, but the data speaks for itself. Too many wells have been drilled in too close proximity. Lowering the injection pressures of individual injection wells alone will not improve the situation if more injection wells are approved into the same formation. Governor Newsom can begin the remediation by stopping the state from permitting new oil and gas wells, banning existing steam injection, and properly plugging and abandoning the leaking wells in these fields. If this is not a priority, California will undoubtedly experience more of these situations, where the density of wells leads to dangerous conditions and increased emissions in more fields, such as the Ventura, Oxnard, and Kern River. It is clear that in addition to high injection pressures, these impacts are the result of over-development via lackadaisical permit reviews and irresponsible environmental policy.

By Kyle Ferrar, MPH, Western Program Coordinator, FracTracker Alliance

Feature Photo by Irfan Khan/LA Times via AP, Pool.
Support this work

`

DONATE

Stay in the know

Governor Newsom Well Watch website for California drilling

Oil & Gas Well Permits Issued By Newsom Administration Rival Those Issued Under Gov. Jerry Brown

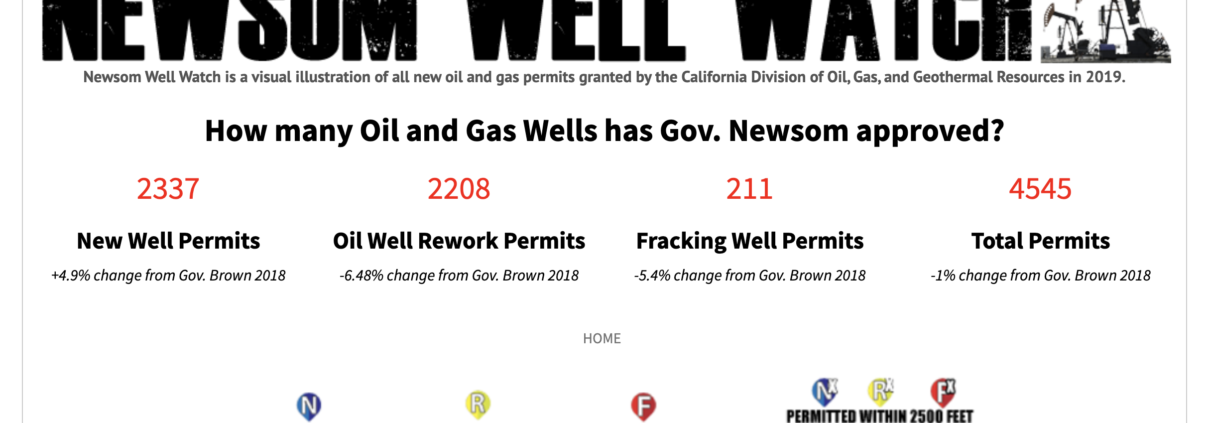
FracTracker Alliance and Consumer Watchdog worked together to produce a map of all oil and gas permits issued in 2019, under Governor Newsom’s watch. Our previous collaborative reports revealed conflicts of interest within the oil and gas regulatory agency, and showed that the rate of permitting new fracking operations and all oil and gas well permits had doubled for the first six months of 2019, as compared to 2018 – Governor Jerry Brown’s last year in office. We have once again updated the data, with supporting maps and visuals to show the state of drilling in the State of California.

“The numbers give fresh urgency on the need to order a 2,500-foot health barrier between oil industry operations and people living as close as just yards away,” Consumer Watchdog and FracTracker Alliance wrote in a letter to Governor Newsom. “Action on this and a start to phasing out oil and gas production in the state simply cannot wait for the results of more time-consuming studies.”


Support this work

`

DONATE

Stay in the know

California is Frack Free, for the Moment

How State Regulations Hold Us back and What Other Countries are doing about Fracking

By Isabelle Weber, FracTracker Alliance Spring 2019 Intern 

Feature photo of oil and gas drilling in North Dakota, and is by by Nick Lund, NPCA, 2014


Although there are some federal regulations in place to protect the environment indirectly from fracking in the United States, the regulations that try to keep fracking in check are largely implemented at the state governing level. This has led to a patchwork of regulations that differ in strictness from state to state. This leads to the concern that there will be a race to the bottom where states lower the strictness of their regulations in order to draw in more fracking. While it might be tempting to welcome an industry that often creates a temporary economic spike, the costs of mitigating the environmental damage from fracking far out-weighs the profit gained. Germany, Scotland, and France are examples of countries that have taken more appropriate regulatory measures to protect their populations from the risks involved in unconventional oil and gas development.

The Shortfalls of State by State Regulations

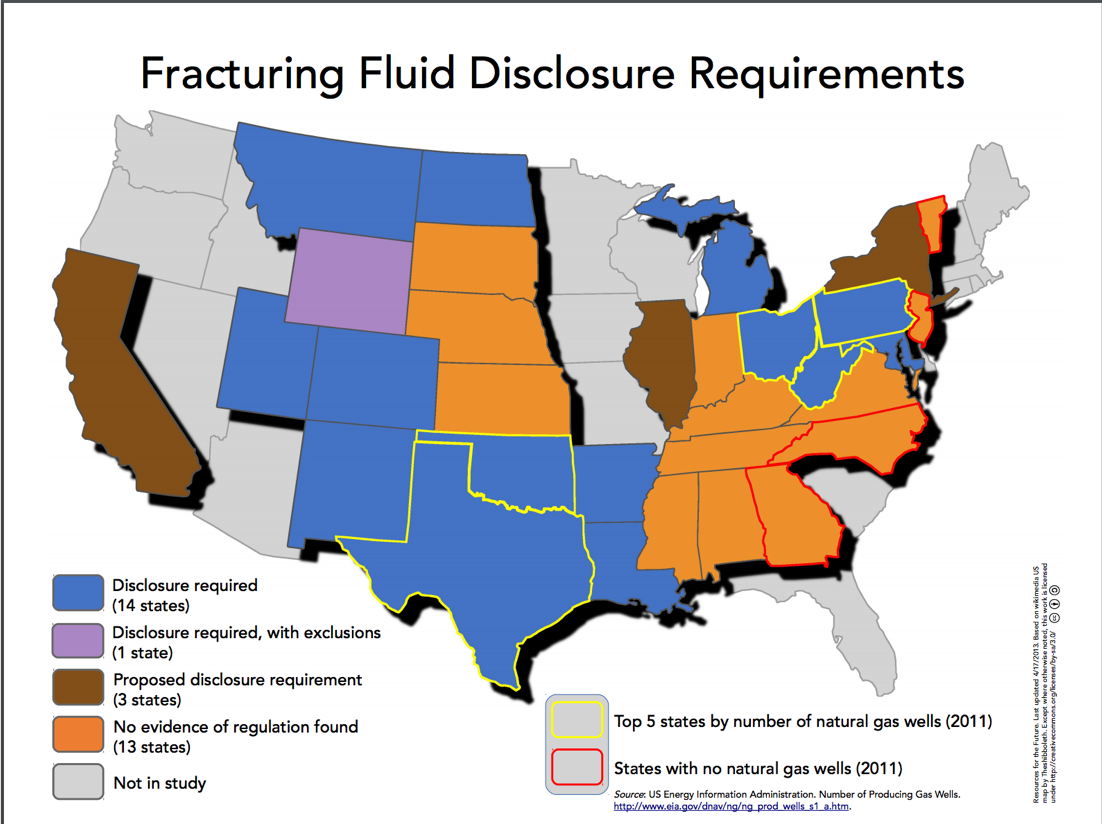
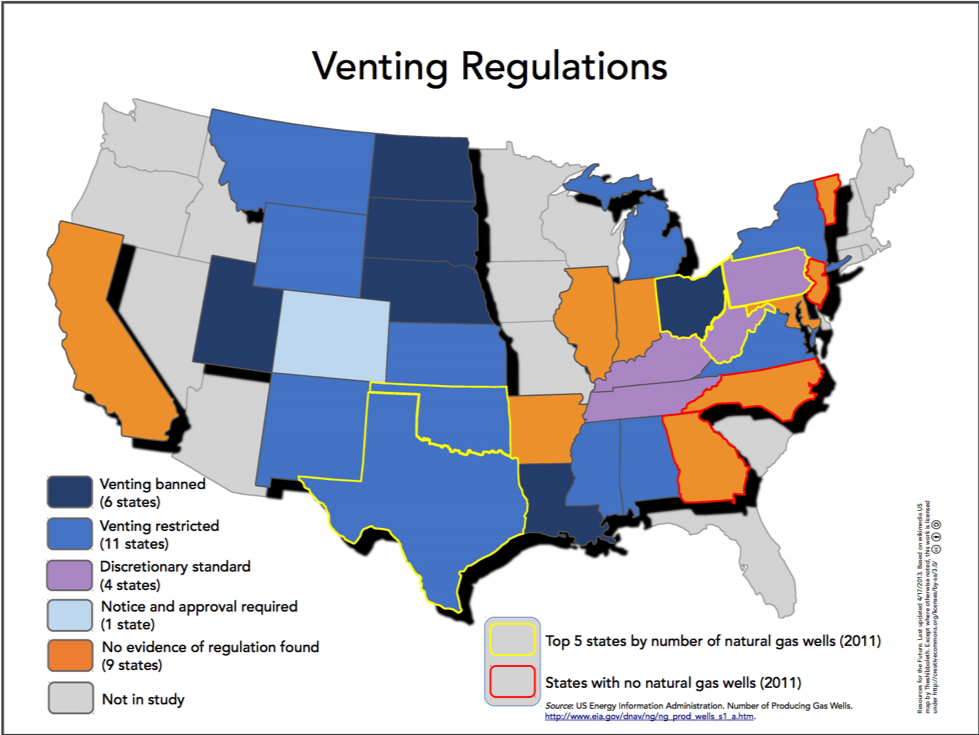
For a detailed overview of how fracking regulation differs between states, check out the Resources for the Future report, The State of State Shale Gas Regulation, which analyzes 25 regulatory elements and how they differ between states. Two of their maps that attest to this vast difference in regulation are the “Fracturing Fluid Disclosure Requirements” map as well as the “Venting Regulations” map.

The “Fracturing Fluid Disclosure Requirements” map shows regulatory differences between states regarding whether or not the chemical mixture used to break up rock formations must be made known to the public. “Disclosure” means that the chemical mixture is made known to the public and “No Regulation” means that there is nothing that obligates companies to share this information, which usually implies this information is not available.

Fig 1. Map of fracking fluid disclosure requirements by state, from Resources for the Future’s report, “The State of State Shale Gas Regulation.” Original data from US Energy Information Administration.


Note from the editor: There are several exemptions that allow states to limit the scope of reporting chemicals used in underground fluid injection for fracking. For example, all states that require chemical disclosure are entitled to exemptions for chemicals that are considered trade secrets.  

Concealing the identity of chemicals increases the risk of harm from chemical exposure for people and the environment. Emergency first responders are especially at risk, as they may have to act quickly to put out a fracking-induced fire without knowing the safety measures necessary to avoid exposure to dangerous chemicals. The population at large is at risk of exposure though several pathways such as leaks, spills, and air emissions. Partnership for Policy Integrity, along with data analysis by FracTracker, investigated the implications of keeping the identity of certain fracking chemicals secret in two states, Ohio and Pennsylvania. These reports point to evidence that exposure to concealed fracking chemicals could have serious health effects including blood toxicity, developmental toxicity, liver toxicity and neurotoxicity.


The second map, “Venting Regulations,” shows which states have regulations that limit or ban venting and which do not. Venting is the direct release of methane from the well site into the atmosphere. Methane has 30 times the green-house gas effect as carbon dioxide. Given methane’s severe impact on the environment, no venting whatsoever should be allowed at well sites.

Fig 2. Map of fracking venting regulations by state, from Resources for the Future’s report, “The State of State Shale Gas Regulation.” Original data from US Energy Information Administration.

Having overarching federal regulatory infrastructure to regulate fracking would help to avoid risks such as toxic chemical exposure and accelerated climate change. Although leaving regulation development to states allows for more specialized laws, there are certain aspects of environmental protection that apply to every area in the United States and are necessary as standard protection against the effects of fracking.

How do other countries regulate fracking?

Stronger federal regulation of fracking has worked well in the past and can be seen in several other countries.

Germany

In 2017, Germany passed new legislation that largely banned unconventional hydraulic fracking. The ban on unconventional fracking excludes four experimental wells per state that will be commissioned by the German government to an independent expert commission to identify knowledge gaps and risks with regards to fracking. Conventional fracking also received tighter regulations including a ban on fracking near drinking water sources. In 2021, the ban will be reevaluated, taking into account research results, public perception, long term damage to residents and the environment, and technological advances. This is a perfect example of how a country can use overarching federal regulation to make informed decisions about industry action.

Scotland

In 2015, Scotland placed a moratorium into effect that halted all fracking in the country. Since 2017, the government has held that the moratorium will stand indefinitely as an effective ban on fracking in the country, but the country is still working on the legislature that will officially ban fracking. Meanwhile, the Scottish government conducted one of the most far-reaching investigations into unconventional oil and gas development, which included a four-month public consultation period. This public consultation garnered 65,000 responses, 65% of which were from former coal mining communities targeted by the fracking industry. Of those responses, 99% of responses opposed fracking.

The Scottish people should be applauded for holding their federal government accountable in fulfilling its responsibility to protect its people and its environment against the effects of fracking.

France

In December 2017, France passed a law that bans exploration and production of all oil and natural gas by the year 2040. This applies to mainland France as well as all French territories. Although France has limited natural gas resources, it is hoped that the ban will be contagious and spread to other countries. This is a prime example of a country making a decision to protect their environment through regulation.

Although France’s banning of fracking was largely symbolic and may not result in a considerable reduction of greenhouse gases related to natural gas exploration, the country is sending a message to the world that we need to facilitate the end of the fossil fuel era and a move toward renewables.

Back to the US, the world’s leading producer of natural gas

Federal regulation on fracking should be holding the oil and gas industry in check by requiring states to meet basic measures to protect people and the environment. States could then develop more stringent regulations as they see fit. It is important that we come to a national consensus on the environmental and health hazards of fracking, and consequently, to adopt appropriate federal regulations.


By Isabelle Weber, FracTracker Alliance Spring 2019 Intern

Support this work

`

DONATE

Stay in the know

Ohio Secret Fracking Chemicals Report

Ohio’s Secret Fracking Chemicals

The Mountaineer State: Where Politics, a Fossil Fuel Legacy, and Fracking Converge

Introduction

The Mountaineer State is one of the most stunningly beautiful states in all the United States, despite its complicated and unique relationship with fossil fuels dating back to the West Virginia Coal Wars of 1912 to 1921. This relationship has compromised the state’s distinctive ecosystems and its social cohesion. Instead of remediating or preventing the impacts of fossil fuels, the state’s elected officials have exploited them for political and monetary gain.  Understanding this history and the potential next steps in the march of the fossil fuel industry will help those who continue to fight for an alternative future for West Virginia.  At the same time, it is critical that we identify legislation that would perpetuate fossil fuel dependence, the individuals who are behind said legislation, and the current extent of the fossil fuel industry, especially considering the developing Appalachian Storage and Trading Hub (ASTH) that is supported by the elected officials in in D.C. and Charleston.

Ohio Power’s Mitchell (Foreground) and Kammer (Background) Coal Power Plants, Marshall County, Combined Capacity 2,345 MegaWatts. Photo by Ted Auch, aerial assistance provided by LightHawk

Impeding Fossil Fuel Developments Threaten West Virginia Once Again

West Virginia has a rich, complicated, and occasionally violent history with coal mining and now is at the vanguard of the High Volume Hydraulic Fracturing (HVHF) revolution. It also happens to sit at the heart of what Appalachian governors, senators, and even land-grant universities are touting is the panacea for all that ails the region: the Appalachian Storage and Trading Hub (ASTH), a key part of the Ohio River Valley petrochemical build out. This puts West Virginia in a peculiar position, with one foot longingly in the past with coal mining and one moving forward with investments in fracking and now the ASTH.

On the one hand, there is local optimism about King Coal’s return, stoked by Donald Trump and industry friends like Robert Murray. A closer look reveals they are sending decidedly different messages to Appalachian coal miners and their families, with the former stating repeatedly that he would bring coal back, and the latter agreeing but offering the caveat that “Trump can’t bring jobs back . . . [because] many of those jobs were lost to technology rather than regulation.”

Murray Energy’s Consolidation Coal Mine, Marshall County

This is not to suggest that there are hard feelings between Trump and Murray; a Document Investigations publication reveals an invitation from Murray Energy to host a Trump fundraiser on July 24, 2019 in Wheeling, West Virginia at WesBanco Arena with a cover charge of $150.00 made payable to Trump Victory, Donald Trump and the Republican National Committee’s joint presidential campaign fundraising. West Virginia Governor Jim Justice (who is uncoincidentally a leading booster of the ASTH) indicated he would be in attendance. Additionally, Murray in his rescheduling letter to the West Virginia governor indicated, “Present with us will be Governors Mike DeWine of Ohio, Jim Justice of West Virginia, and Matt Bevins of Kentucky; Senators Shelley Moore Capito and Rob Portman of these states; and Congressman Bill Johnson and Dave McKinley and the House Speaker and Senate President form the two states.”

Declining Jobs, Increasing Automation

After at least seventeen years of 5% declines in net coal production, and 3% increases in hiring, the coal mining industry in West Virginia had had enough. Starting in 2012, they turned the tide on labor by leaning into the automation revolution and in the process, mine labor has declined by 8% per year since then. Automation and an increasing reliance on more blunt methods of mining, including strip-mining and/or Mountaintop Removal, have allowed the mining industry to increase productivity per labor hour by 5.8% to 6.3% per year since 2012, according to data compiled by US Department of Labor’s Office of Mine Safety and Health Administration. All of these savings translate into Mergers And Acquisitions as well as hefty profits for the likes of Murray, private equity and large institutional investors that have no interest in the welfare of Appalachia, its people, and the constant undertone of labor vs. capital throughout the region.

Even with all the corporate, state, and federal subsidies we have still had a rash of bankruptcies in the last three months. Most recently, Revelation Energy and its affiliate Blackjewel, experts in “Vulture Capitalism,” filed for Chapter 11 on July 1st of this year causing countless bounced paychecks among their 1,700 employees across Virginia, Wyoming, Kentucky, and West Virginia.

So while King Coal continues to paint federal regulations as excessively burdensome and the primary impediment to their expansion, it is clear that the enemy of coal miners is not regulations, but rather automation and the urgent attempt to squeeze every last drop of profitability out of a dying industry.  even as coal production nationally declines by nearly double digits annually, a signal that the end is near, mining companies are able to continue generating reliable profits thanks to automation and artificial intelligence. This might be why private equity climate change denying titans like Stephen Schwarzman are investing so heavily in the likes of MIT’s School of Artificial Intelligence. The growing discrepancy between coal production and coal jobs was pointed out in a recent Columbia University report on the failure of states, counties, and communities to prepare themselves for the day when their status as “company towns”[1] will switch from a point of pride to a curse. The Columbia researchers pointed out that:

“Employment in the coal mining industry declined by over 50 percent in West Virginia, Ohio, and Kentucky between 2011 and 2016. State-level impacts mask even more severe effects at local levels. In Mingo County, West Virginia, coal mining employed over 1,400 people at the end of 2011. By the end of 2016, that number had fallen below 500. Countywide, employment fell from 8,513 to 4,878 over this period  . . . suggesting there could be important labor market spillovers from mining to the broader economy.”

A Bloody History Haunts West Virginia’s Coal Fields

The last time West Virginia experienced “important labor market spillovers” was during the West Virginia Coal Wars of 1912 to 1921. West Virginia University Press, in summarizing the book “Life, Work, and Rebellion in the Coal Fields: The Southern West Virginia Miners, 1880-1922” by David Alan Corbin, describes this violent moment in the state’s history:

“Between 1880 and 1922, the coal fields of southern West Virginia witnessed two bloody and protracted strikes, the formation of two competing unions, and the largest armed conflict in American labor history – a week-long battle between 20,000 coal miners and 5,000 state police, deputy sheriffs, and mine guards. These events resulted in an untold number of deaths, indictments of over 550 coal miners for insurrection and treason, and four declarations of martial law. Corbin argues that these violent events were collective and militant acts of aggression interconnected and conditioned by decades of oppression. His study goes a long way toward breaking down the old stereotypes of Appalachian and coal-mining culture”

The Coal Wars culminated in the August 1921 Battle of Blair Mountain, the largest labor uprising in United States history which resulted in a deadly standoff between 10,000 armed coal miners and 3,000 strikebreakers called the Logan Defenders. The battle resulted in a casualty range of 20 to 100 as well as the treason conviction of some 22+ United Mine Workers of America members. This crushed the union, and the larger effect was a chill throughout Appalachia for more than a decade.

A similar chill is beginning to percolate as part of the fear around resistance or questioning of the ASTH and its myriad tentacles. This chill is coupled with a growing ambivalence and resignation to the most recent colonization of the Ohio River Valley by yet another iteration of the fossil fuel industrial complex.

How Can Appalachia Escape the Tight Grip of the Hydrocarbon Industrial Complex?

The state’s historical labor strife is worth mentioning to emphasize that Appalachia has been thrown under the “natural resource curse” bus before, and it has not responded kindly (see documentary “Harlan County USA” directed by Barbara Kopple). This might be why industry stakeholders fund the likes of the Koch Brothers-backed American Legislative Executive Council in efforts to pass dubiously titled “critical infrastructure” bills that they’ve written in states including the ASTH states of Ohio, Pennsylvania, Kentucky, and West Virginia. [2]  It also might be why West Virginia Senator Manchin is trying to separate himself from his prior optimism about the supposed $84 billion China would invest in ASTH related projects across the state and his willingness to compromise the safety of his own constituents for the sake of profiteering state-backed firms in China, Saudi Arabia, and Thailand.

It won’t be long before we start to hear echoes of Florence Reece’s 1931 labor resistance anthem “Which Side Are You On?” echoing out from every peak and holler in West Virginia in reference to Manchin and Justice.  Their milquetoast response to questioning around the viability of the ASTH prompted the West Virginia Gazette editorial page to write:

“So far, the entire project, which was hailed as the salvation of West Virginia’s economy at the time, looks like nothing but smoke and confetti. There’s been no movement and the Justice administration rarely mentions it unless asked. The reply has typically been a guarded ‘it’s happening’ and not much else. It’s time for state government to level with the people of West Virginia on what exactly is happening here. Not only did the announcement raise false hopes, but the question of national security is valid and important. We urge the governor or someone in his administration to give an official update on the project.”

In the interim, West Virginia’s elected officials continue to prop up coal as the Mountaineer State’s salvation. But the gig will be up eventually. It appears that there are two ways to exit this zero-sum relationship with the fossil fuel industry according to the neoliberal economic model we espouse here in the United States: 1) A Glide Path strategy that will allow West Virginia to methodically transition to a more diversified economy, or 2) an extremely painful Jump Condition type transition over a much shorter period of time that will likely last no more than a couple of years and leave West Virginians very angry and looking for someone to blame.

Those of us that accept climate change as fact, advocate for the Green New Deals of the world, and work towards a renewable energy future can easily dismiss either pathway’s impacts on Appalachia with the mantra, “Hey, they [Appalachia] made their bed now they have to lie in it!” However, this would be counter to the social contract narrative we have created for this country and would be incredibly hypocritical given that the primary steroid that fueled American Exceptionalism/Capitalism was cheap and abundant domestic fossil fuels. As Kim Kelly of Teen Vogue so perfectly put it in laying out her very personal connections to the struggle between the need to pay bills and the environmental impacts of fossil fuel reliant jobs: “Make no mistake: The coal miner and pipeline worker know about the environmental costs of their labor, but when faced with the choice of feeding their kids or putting down their tools in the name of saving the planet, the pressures of capitalism tend to win; their choice is made for them.”

Cravat Coal Mine Slurry Pond, Marshall County, West Virginia

Americans rationalize our dependence on fossil fuels on one hand, while simultaneously hectoring those who work tirelessly to get the stuff out of the ground and invest in the companies that employ them by way of 401Ks or other investment vehicles. This hypocrisy is not lost on Appalachia nor should it be. Climate advocates should work with states like West Virginia to transition to a more just future that does not include a doubling down on fossil fuels by way of the ASTH and fracking. If not, the social and political divisions in this country will pale in comparison to what will likely result from a piecemeal and confrontational transition away from the fossil fuel industrial complex that we’ve been told we can’t live without.

Furthermore, we can’t address these issues without acknowledging the selective interventionist policy our government has deployed in the name of “nation building” in the Middle East and elsewhere. Folks like John Perkins, Naomi Klein, and Joseph Stiglitz have demonstrated that our interventionist policy is just a poor cover for the true modus operandi which would be resource control from Saudi Arabia to the most recent example being the effort by the Trump administration to foment opposition to Venezuelan leader Nicholas Maduro. If the latter example isn’t primarily about oil than why do the bi-partisan sanctions include exceptions to allow Chevron, Halliburton, and Schlumberger to continue to operate in Venezuela?

A Path Forward

The Green New Deal is a first step in establishing a path forward for the decarbonization of the US economy and it correctly includes calls for a transition that “would ensure protections for coal miners and other impacted fossil fuel workers.” While mostly nebulous and aspirational at this point, the Green New Deal offers much needed hope and guidance towards a future where economic growth is decoupled from CO2 emissions. Yet, it will have to address the underlying issues associated with economic inequality and the fact that states like West Virginia will have to be involved in the decision-making process rather than having the Green New Deal foisted on them. Otherwise, the Mountaineer State’s politicians in D.C. and Charleston will continue to get away with toying with their constituents’ hopes and dreams with proclamations that the ASTH and rumored infrastructure proposals will provide salvation. In reality, the ASTH is just another corporatist stunt to optimize shareholder return on the backs of Appalachians.  This tension was summarized beautifully and succinctly by United Mine Workers of America spokesman Phil Smith who told Reuters, “We’ve heard words like ‘just transition’ before, but what does that really mean? Our members are worried about putting food on the table.”

As Joel Magnuson wrote in his revolutionary text “Mindful Economics”:

“ . . . the need to maximize profits for a relatively small section of the U.S. population has shaped the development of America’s most powerful institutions . . . the need for higher profits and endless growth has intensified environmental destruction, resource depletion, instability, social and political inequality, and even global warming. These problems have become systemic and solutions therefore require long-term systemic change . . . [and the development of] alternative institutions. As these alternatives evolve and grow, they will place the U.S. economy on a path to a new system. Systemic change will come about gradually by the will of people who purposefully steer the development of the economic institutions in their communities in a positive and healthy direction. To this end Mindful Economics lays a foundation for building new alternatives that are democratic, locally-based and ecologically sustainable. Such alternatives are not only viable, they can be found all across the United States. Through a network of alternative institutions, people can begin to build alternatives to capitalism and provide hope for future generations.”

Ecotrust’s Conservation Economy website offers a road map for how Appalachia can move towards an alternative future that “integrates Social, Natural, and Economic Capital” (see the pattern map below).  Appalachia has been stripped of much of its economic capital but it still has a bountiful supply of social and natural capital!

Conservation Economy's Pattern Map

Conservation Economy’s Pattern Map

The Map

We constructed a map that illustrates West Virginia’s past, present, and future dependence on fossil fuels. The map shows 16,864 oil, gas, and coal parcels as well as those that are rumored to be of interest to the fossil fuel industrial complex in the near future. The parcels average 164 acres in size and amount to 2,770,310 acres or 4,329 square miles. These parcels amount to 17.9% of West Virginia but are largely concentrated in the counties of Boone, Kanawha, Logan, Wyoming, McDowell, Mingo, and Fayette.

Also included in this map are:

  1.  annual production data for 880 mines between 2001 and 2017 and
  2.  annual oil, natural gas, and natural gas liquid (NGL) production for 3,689 unconventional wells between 2002 and 2018.

A sizeable portion of the parcel query we conducted, especially the rumored ones, occurred as a result of insight from Ohio Valley Environmental Coalition (OVEC) community organizer Alex Cole and his extensive network of contacts along the Ohio River Valley.

View map fullscreen | How FracTracker maps work


By Ted Auch, Great Lakes Program Coordinator, FracTracker Alliance with invaluable data compilation assistance from Gary Allison

[1] If you aren’t familiar with this term I would refer you to Columbia University’s data for Boone County, West Virginia: “The numbers suggest that about a third of Boone County’s revenues directly depended on coal in the form of property taxes on coal mines and severance taxes. In 2015, 21 percent of Boone County’s labor force and 17 percent of its total personal income were tied to coal. Coal property (including both the mineral deposit and industrial equipment) amounted to 57 percent of Boone County’s total property valuation. Property taxes on all property generated about half of Boone County’s general fund budget, which means that property taxes just on coal brought in around 30 percent of the county’s general fund. Property taxes on coal also funded about $14.2 million of the $60.3 million school budget (24 percent). In total, coal-related property taxes generated approximately $21 million for Boone County’s schools, the county government, and specific services.”

[2] ALEC finalized their “Model Policy” in December, 2017, and gave it the ultimate Orwellian title of “Critical Infrastructure Protection Act.” Many elected officials throughout the fossil fuel network’s Heartland have introduced this legislation nearly verbatim, including Ohio State Senator Frank Hoagland’s S.B. 33, which represents much of Ohio’s Ohio River Valley, where the ASTH would have its most pronounced impacts.

If this article was helpful to you, please contribute to FracTracker today. Any amount is greatly appreciated!
Donate Today
Want to stay up to date on FracTracker articles like this one? Sign up for our free monthly newsletter to stay in the know.
Get the Newsletter

The Underlying Politics and Unconventional Well Fundamentals of an Appalachian Storage Hub

FracTracker is closely mapping and following the petrochemical build-out in Appalachia, as the oil and gas industry invests in petrochemical manufacturing. Much of the national attention on the build-out revolves around the Appalachian Storage Hub (ASH), a venture spearheaded by Appalachian Development Group.

The ASH involves a network of infrastructure to store and transport natural gas liquids and finds support across the political spectrum. Elected officials are collaborating with the private sector and foreign investors to further development of the ASH, citing benefits such as national security, increased revenue, job creation, and energy independence.

Left out of the discussion are the increased environmental and public health burdens the ASH would place on the region, and the fact that natural gas liquids are the feedstock of products such as plastic and resins, not energy.

The “Shale Revolution”

the allegheny plateau

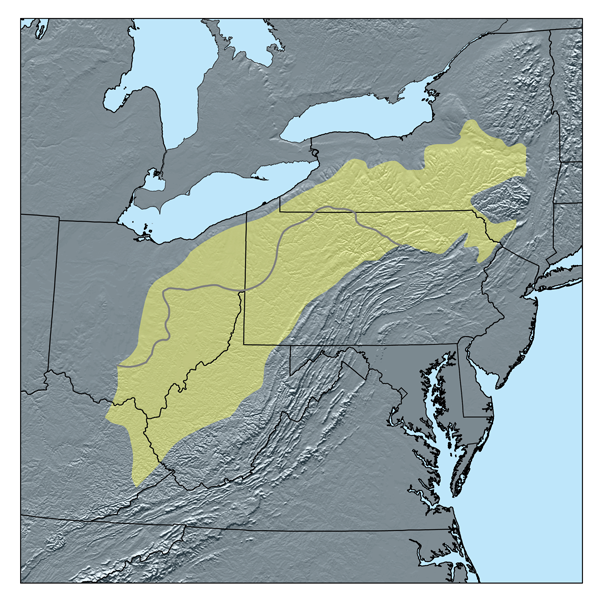
The Allegheny Plateau. Wikipedia

The “Shale Revolution” brought on by high-volume hydraulic fracturing (fracking) in this region encompasses thousands of wells drilled into the Marcellus and Utica-Point Pleasant shale plays across much of the Allegheny Plateau. This area spans from north of Scranton-Wilkes Barre, Pennsylvania, just outside the Catskills Mountains to the East in Susquehanna County, Pennsylvania, and down to the West Virginia counties of Logan, Boone, and Lincoln.  The westernmost extent of the fracking experiment in the Marcellus and Utica shale plays is in Noble and Guernsey Counties in Ohio.

Along the way, producing wells have exhibited steeper and steeper declines during the first five years of production, leading the industry to develop what they refer to as “super laterals.” These laterals (the horizontal portion of a well) exceed 3 miles in length and require in excess of 15 million gallons of freshwater and 15,000 tons of silica sand (aka, “proppant”)[1].

The resource-intense super laterals are one way the industry is dealing with growing pressure from investors, lenders, the media, state governments, and the public to reduce supply costs and turn a profit, while also maintaining production. (Note: unfortunately these sources of pressures are listed from most to least concerning to industry itself!)

Another way the fracking industry is hoping to make a profit is by investing in the region’s natural gas liquids (NGLs), such as ethane, propane, and butane, to support the petrochemical industry.

The Appalachian Storage Hub

Continued oil and gas development are part of a nascent effort to establish a mega-infrastructure petrochemical complex,  the Appalachian Storage Hub (ASH). For those that aren’t familiar with the ASH it could be framed as the fracking industry’s last best attempt to lock in their necessity across Appalachia and nationwide. The ASH was defined in the West Virginia Executive as a way to revitalize the Mountain State and would consist of the following:

“a proposed underground storage facility that would be used to store and transport natural gas liquids (NGLs) extracted from the Marcellus, Utica and Rogersville shales across Kentucky, Ohio, Pennsylvania and West Virginia. Construction of this hub would not only lead to revenue and job creation in the natural gas industry but would also further enable manufacturing companies to come to the Mountain State, as the petrochemicals produced by shale are necessary materials in most manufacturing supply chains…[with] the raw materials available in the region’s Marcellus Shale alone…estimated to be worth more than $2 trillion, and an estimated 20 percent of this shale is composed largely of ethane, propane and butane NGLs that can be utilized by the petrochemical industry in the manufacturing of consumer goods.”

This is yet another example of fracking rhetoric that appeals to American’s sense of patriotism and need for cheaper consumer goods (in this case, plastics), given that they are seeing little to no growth in wages.

While a specific location for underground storage has not been announced, the infrastructure associated with the ASH (such as pipelines, compressor stations, and processing stations) would stretch from outside Pittsburgh down to Catlettsburg, Kentucky, with the latter currently the home of a sizeable Marathon Oil refinery. The ASH “would act like an interstate highway, with on-ramps and off-ramps feeding manufacturing hubs along its length and drawing from the available ethane storage fields. The piping would sit above-ground and follow the Ohio and Kanawha river valley.”

The politics of the ASH – from Columbus and Charleston to Washington DC

Elected officials across the quad-state region are supporting this effort invoking, not surprisingly, its importance for national security and energy independence.

State-level support

West Virginia Senator Joe Manchin (D) went so far as to introduce “Senate Bill 1064 – Appalachian Energy for National Security Act.”  This bill would require Secretary of Energy Rick Perry and his staff to “to conduct a study on the national security implications of building ethane and other natural-gas-liquids-related petrochemical infrastructure in the United States, and for other purposes.”

Interestingly, the West Virginia Senator told the West Virginia Roundtable Inc’s membership meeting that the study would not examine the “national security implications” but rather the “additional security benefits” of an Appalachian Storage Hub and cited the following to pave the way for the national security study he is proposing: “the shale resource endowment of the Appalachian Basin is so bountiful that, if the Appalachian Basin were an independent country, the Appalachian Basin would be the third largest producer of natural gas in the world.”

Senator Manchin is not the only politician of either party to unabashedly holler from the Appalachian Mountaintops the benefits of the ASH. Former Ohio Governor, and 2016 POTUS primary participant, John Kasich (R) has been a fervent supporter of such a regional planning scheme. He is particularly outspoken in favor of the joint proposal by Thailand-based PTT Global Chemical and Daelim to build an ethane cracker in Dilles Bottom, Ohio, across the Ohio River from Moundsville, West Virginia. The ethane cracker would convert the region’s fracked ethane into ethylene to make polyethylene plastic. This proposed project could be connected to the underground storage component of the ASH.

The Democratic Pennsylvania Governor Tom Wolf has consistently advocated for the project, going so far as to sign “an unprecedented agreement at the Tri-State Shale Summit, promising collaboration between the states in securing crackers for the region and, by extension, support of the storage hub.”

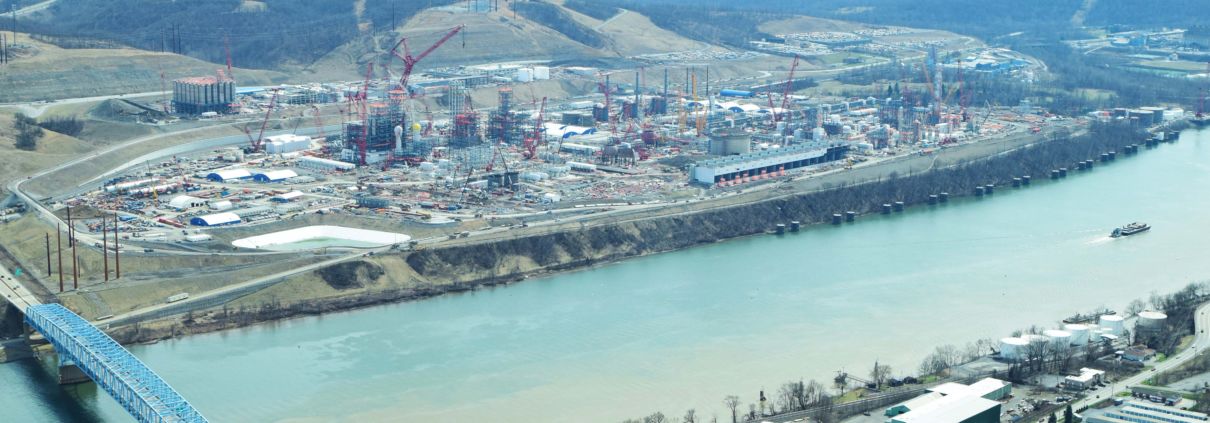
Dilles Bottom, OH ethane cracker site. Photo by Ted Auch, aerial assistance provided by LightHawk.

Not to be outdone in the ASH cheerleading department, West Virginia Governor Jim Justice (R), who can’t seem to find any common ground with Democrats in general nor Senator Manchin specifically, is collaborating with quad-state governors on the benefits of the ASH. All the while, these players ignore or dismiss the environmental, social, and economic costs of such an “all in” bet on petrochemicals and plastics.

Even the region’s land-grant universities have gotten in on the act, with West Virginia University’s Appalachian Oil and Natural Gas Research Consortium and Energy Institute leading the way. WVU’s Energy Institute Director Brian Anderson pointed out that, “Appalachia is poised for a renaissance of the petrochemical industry due to the availability of natural gas liquids. A critical path for this rebirth is through the development of infrastructure to support the industry. The Appalachian Storage Hub study is a first step for realizing that necessary infrastructure.”

National-level support

The Trump administration, with the assistance of Senator Manchin’s “Senate Bill 1337 – Capitalizing on American Storage Potential Act”, has managed to stretch the definition of the Department of Energy’s Title XVII loan guarantee to earmark $1.9 billion for the Appalachian Development Group, LLC (ADG) to develop the ASH, even though any project that receives such a loan must:

  1. utilize a new or significantly improved technology;
  2. avoid, reduce or sequester greenhouse gases;
  3. be located in the United States; and,
  4. have a reasonable prospect of repayment.

This type of Public-Private Investment Program  is central planning at its finest, in spite of the likelihood that the prospects of the ASH meeting the second and fourth conditions above are dubious at best (even if the project utilizes carbon capture and storage technologies).

Public-Private Investment Programs have a dubious past. In her book “Water Wars,” Vandana Shiva discusses the role of these programs globally and the involvement of institutions like the World Bank and International Monetary Fund:

“public-private partnerships”…implies public participation, democracy, and accountability.  But it disguises the fact that the public-private partnership arrangements usually entail public funds being available for the privatization of public goods…[and] have mushroomed under the guise of attracting private capital and curbing public-sector employment.”

In response to the Department of Energy’s Title XVII largesse, Congresswoman Pramila Jayapal and Ilhan Omar introduced Amendment 105 in Rule II on HR 2740. According to Food and Water Watch, this amendment would restrict “the types of projects the Department of Energy could financially back. It would block the funding for ALL projects that wouldn’t mitigate climate change.”

On Wednesday, June 19th Congress voted 233-200 along party lines to pass the amendment, preventing funds from the Energy Policy Act of 2005  to be provided to any “project that does not avoid, reduce, or sequester air pollutants or anthropogenic emissions of greenhouse gases”.

International interest

The only condition of Department of Energy’s Title XVII loan program ASH is guaranteed to meet is the third (be located in the United States), but as we’ve already mentioned, the level of foreign money involved complicates the domestic facade.

Foreign involvement in the ASH lends credence to Senator Manchin’s and others’ concerns about where profits from the ASH will go, and who will be reaping the benefits of cheap natural gas. The fact that the ASH is being heavily backed by foreign money is the reason Senator Manchin raised an issue with the outsized role of state actors like Saudi Arabia and China as well as likely state-backed private investments like PTT Global Chemical’s. The Senator even cited how a potential $83.7 billion investment in West Virginia from China’s state-owned energy company, China Energy, would compromise “domestic manufacturing and national security opportunities.”

“Critical” infrastructure

With all of the discussion and legislation focused on energy and national security, many don’t realize the output of the ASH would be the production of petroleum-based products: mainly plastic, but also fertilizers, paints, resins, and other chemical products.

Not coincidentally, Republican Ohio State Representatives George Lang and Don Jones just introduced House Bill 242, and attempt to support the plastic industry by “prohibit[ing] the imposition of a tax or fee on [auxiliary or plastic] containers, and to apply existing anti-littering law to those containers.”

There will most certainly be a battle in the courts between the state and urban counties like Cuyahoga County, Ohio, who’s council just voted to ban plastic bags countywide on May 28.

Bills like this and the not unrelated “critical infrastructure” bills being shopped around by the American Legislative Exchange Council will amplify the rural vs urban and local vs state oversight divisions running rampant throughout the United States.  The reason for this is that yet another natural resource boom/bust will be foisted on Central Appalachia to fuel urban growth and, in this instance, the growth and prosperity of foreign states like China.

Instead of working night and day to advocate for Appalachia and Americans more broadly, we have legislation in statehouses around the country that would make it harder to demonstrate or voice concerns about proposals associated with the ASH and similar regional planning projects stretching down into the Gulf of Mexico.

Producing wells mapped

Impacts from the ASH and associated ethane cracker proposals will include but are not limited to: an increase in the permitting of natural gas wells, an increase in associated gas gathering pipelines across the Allegheny Plateau, and an exponential increase in the production of plastics, all of which are harmful to the region’s environment and the planet.

The production of the region’s fracked wells will determine the long-term viability of the ASH. From our reading of things, the permitting trend we see in Ohio will have to hit another exponential inflection point to “feed the beast” as it were. Figure 1 shows an overall decline in the number of wells drilled monthly in Ohio.

Figure 2, below it, shows the relationship between the number of wells that are permitted verse those that are actually drilled.

Figures 1. Monthly (in blue) and cumulative (in orange) unconventional oil and gas wells drilled in Ohio, January, 2013 to November, 2018


 Figure 2. Permitted Vs Drilled Wells in Ohio, January, 2013 to November, 2018

That supply-demand on steroids interaction will likely result in an increased reliance on “super laterals” by the high-volume hydraulic fracturing industry. These laterals require 5-8 times more water, chemicals, and proppant than unconventional laterals did between 2010 and 2012.

Given this, we felt it critical to map not just the environmental impacts of this model of fracking but also the nuts and bolts of production over time. The map below shows the supply-demand links between the fracking industry and the ASH, not as discrete pieces or groupings of infrastructure, but rather a continuum of up and downstream patterns.

The current iteration of the map shows production values for oil, natural gas, and natural gas liquids, how production for any given well changes over time, and production declines in newer wells relative to those that were fracked at the outset of the region’s “Shale Revolution.” Working with volunteer Gary Allison, we have compiled and mapped monthly (Pennsylvania and West Virginia) and quarterly (Ohio)[2] natural gas, condensate, and natural gas liquids from 2002 to 2018.

This map includes 15,682 producing wells in Pennsylvania, 3,689 in West Virginia, and 2,064 in Ohio. We’ve also included and will be updating petrochemical projects associated with the ASH, either existing or proposed, across the quad-states including the proposed ethane cracker in Dilles Bottom, Ohio and the ethane cracker under construction in Beaver County, Pennsylvania, along with two rumored projects in West Virginia.


View Map Full Screen

Conclusion

We will continue to update this map on a quarterly basis, will be adding Kentucky data in the coming months, and will be sure to update rumored/proposed petrochemical infrastructure as they cross our radar. However, we can’t be everywhere at once so if anyone reading this hears of legitimate rumors or conversations taking place at the county or township level that cite tapping into the ASH’s infrastructural network, please be sure to contact us directly at info@fractracker.org.

By Ted Auch, Great Lakes Program Coordinator, FracTracker Alliance with invaluable data compilation assistance from Gary Allison

Feature Photo: Ethane cracker plant under construction in Beaver County, PA. Photo by Ted Auch, aerial assistance provided by LightHawk.

[1] For a detailed analysis of the HVHF’s increasing resource demand and how lateral length has increased in the last decade the reader is referred to our analysis titled “A Disturbing Tale of Diminishing Returns in Ohio” Figures 12 and 13.

[2] Note: For those Bluegrass State residents or interested parties, Kentucky data is on its way!

Permitting New Oil and Gas Wells Under the Newsom Administration

California regulators halt well permitting after Consumer Watchdog and FracTracker reveal a surge in well permits under California Governor Newsom

October 24th, 2019 update: 

There have been several exciting updates since FracTracker Alliance and Consumer Watchdog released a report on fracking and regulatory corruption under Governor Newsom’s administration, detailed in the article below.

On July 11th, 2019, immediately following the report’s release, Governor Newsom fired Ken Harris, head of California’s Division of Oil, Gas, and Geothermal Resources (DOGGR).

Newsom’s chief of staff Ann O’Leary stated:
“The Governor has long held concerns about fracking and its impacts on Californians and our environment, and knows that ultimately California and our global partners will need to transition away from oil and gas extraction. In the weeks ahead, our office will work with you to find new leadership of (the division) that share this point of view and can run the division accordingly.”
FracTracker Alliance supports the governor’s decision and hopes that new leadership acts in the best interests of Californians while moving the state towards 100% renewable energy.

Two months later in September, it was announced that no new fracking permits had been approved in California since the report was issued. We’re thrilled to see this immediate cessation. Yet, while new fracking activity has halted, other forms of oil and gas development continue to threaten Californian’s health and natural resources.

FracTracker Alliance’s review of public records found that DOGGR issued approximately 1,200 permits for steam injection and other “enhanced recovery” techniques through September 2nd, a 60% increase from the 749 permits issued in the same period last year. Sources within DOGGR revealed that at least 40 illegal oil spills from wells were ongoing in Kern and Santa Barbara Counties.

A final development came on October 12th, when Governor Newsom signed a bill to prevent oil and gas development on state lands. As state lands often neighbor federal lands, this bill will play a role in protecting federal land from pipelines, wells, and other polluting infrastructure. Newsom also changed the name of DOGGR to the “Geologic Energy Management Division,” and modified its mission to include protecting public health and environmental quality.

We remain hopeful that Newsom will take a bold stance in leading California away from fossil fuels.

Original July 11th, 2019 FracTracker article:

FracTracker Alliance and Consumer Watchdog have uncovered new data showing an increase in oil and gas permitting by California regulators in 2019 compared to 2018, calling into question Governor Gavin Newsom’s climate commitment. Even more concerning, this investigation found that state regulators are heavily invested in the oil companies they regulate.

FracTracker Alliance’s new report with Consumer Watchdog compares oil and gas permitting policies of the current Governor Gavin Newsom’s administration with that of former Governor Jerry Brown’s administration.

The former lieutenant governor to Brown, Governor Newsom has set out to make a name for himself. As part of stepping out of Brown’s shadow, Newsom has expressed support for a Just Transition away from fossil fuels. Governor Newsom’s 2020 budget plan includes environmental justice measures and an unprecedented investment to plan for this transition that includes investments in job training.

Yet five months into Governor Newsom’s first term, regulators are on track to allow companies to drill and “frack” more new oil and gas wells than Brown allowed in 2018. The question now is: will Governor Newsom actually take the next step that Brown could not, and prioritize the reduction of oil extraction in California?

In addition, the Consumer Watchdog report reveals that eight California regulators with the Division of Oil, Gas, and Geothermal Resources (DOGGR) are heavily invested in the oil companies they regulate. FracTracker and Consumer Watchdog are calling for the the removal of DOGGR officials with conflicts of interest, and an immediate freeze on new well approval. Read the letter to Governor Newsom here.

Governor Brown’s Legacy

Around the world, Brown is recognized as a climate warrior. His support of solar energy technology and criticisms of the nuclear and fossil fuel industry was ultimately unique in the late 1970’s.

In 1980, during his second term as Governor and short presidential campaign, he decried that fellow democrat and incumbent President Jimmy Carter had made a “Faustian bargain” with the oil industry. Since then, he has continued to push for state controls on greenhouse gas emissions. To end his political career, Brown hosted an epic climate summit in San Francisco, California, which brought together climate leaders, politicians, and scientists from around the world.

While Brown championed the reduction of greenhouse gas emissions, his policies in California were contradictory. While front-line communities called for setbacks from schools, playgrounds, hospitals and other sensitive receptors, Brown ignored these requests. Instead he sought to spur oil production in the state. Brown even used state funds to explore his private properties for oil and mineral resources that could be exploited for personal profit.

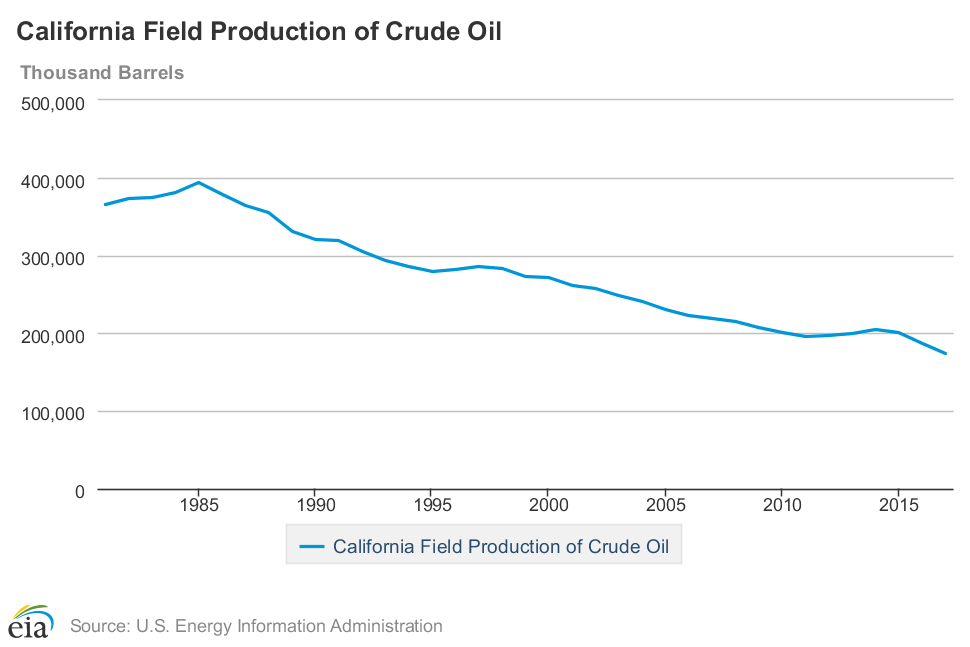
Brown’s terms in the Governor’s office show trends of increasing oil and gas production. The chart in Figure 1 shows that during his first term (1979-1983), California oil extraction grew towards a peak in production. Then in 2011 at the start of Brown’s second term (2011-2019), crude oil production again inflected and continued to increase through 2015, ending a 25-year period of relatively consistent reduction.

We are therefore interested in looking at existing data to understand if moving forward, Governor Newsom will continue Brown’s legacy of support for California oil production. We start by looking at the first half of 2019, the beginning of Governor Newsom’s term, to see if his administration will also allow the oil and gas industry to increase extraction in California.

Figure 1. Chart of California’s historic oil production, from the EIA

Analysis

The FracTracker Alliance has collaborated with the non-profit Consumer Watchdog to review records of oil and gas well permits issued in 2018 and thus far into 2019.

Records of approved permits were obtained from the CA Department of Conservation’s Division of Oil Gas and Geothermal Resources (DOGGR). Weekly summaries of approved permits for the 52 weeks of 2018 and the first 22 weeks of 2019 (January 1st-June 3rd) were compiled, cleaned, and analyzed. Notices of well stimulations were also included in this analysis. The data is mapped here in the Consumer Watchdog report, as well as in more detail below in the map in Figure 2.

Figure 2. Map of California’s Permits, 2018 and 2019


View map fullscreen | How FracTracker maps work

Findings

At FracTracker, we are known for more than simply mapping, so we have, of course, extracted all the information that we can from this data. The dataset of DOGGR permits included details on the type of permit as well as when, where, and who the permits were granted. With this information we were able to answer several questions.

Of particular note and worthy of prefacing the data analysis was the observation of the very low numbers of permits granted in the LA Basin and Southern California, as compared to the Central Valley and Central Coast of California.

First, what are the types of permits issued?

Regulators require operators to apply for permits for a number of activities at well sites. This dataset includes permits to drill wells, including re-drilling existing wells, permits to rework existing wells, and permits to “sidetrack”. Well stimulations using techniques such as hydraulic fracturing and acid fracturing also require permits, as outline in CA State Bill 4.

How many permits have regulators issued?

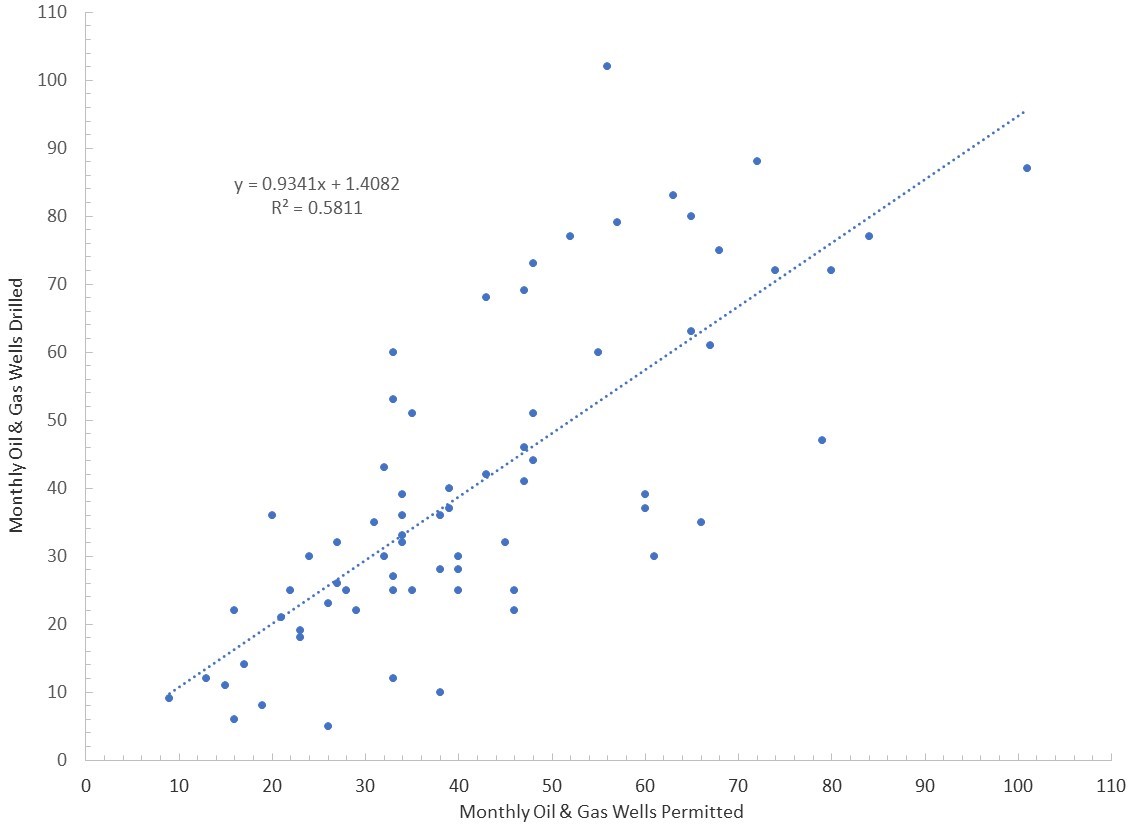
In 2018, DOGGR approved 4,368 permits, including 2,124 permits to drill wells. In 2019, DOGGR approved 2,366 permits from January 1 – June 3, including 1,212 permits to drill wells. At that rate, DOGGR will approve 5,607 total permits by the end of 2019, including 2,872 wells.

That is an increase of 28.3% for total permits and an increase of 35.3% for drilling oil and gas wells.

DOGGR also issued 222 permits for well stimulations in 2018. So far in 2019, DOGGR has issued 191 permits for well stimulations, an increase of 103.2%.

Who is applying for permits?

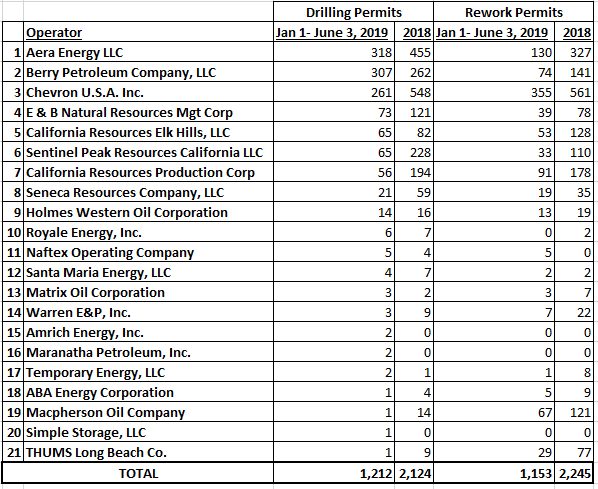
As shown in Table 1 below, the operators Chevron U.S.A. Inc., Aera Energy LLC ( a joint conglomerate of Shell Oil Company and ExxonMobil), and Berry Petroleum Company, LLC dominate the drilling permit counts for both 2018 and 2019.

Aera has obtained the most drilling permits thus far into 2019, while Chevron obtained the most permits in 2018, almost 100 more than Aera. In 2019, Chevron was issued almost 3 times the amount of rework permits as Aera, and both have outpaced Berry Petroleum.

Table 1. Permit Counts by Operator

Where are the permits being issued?

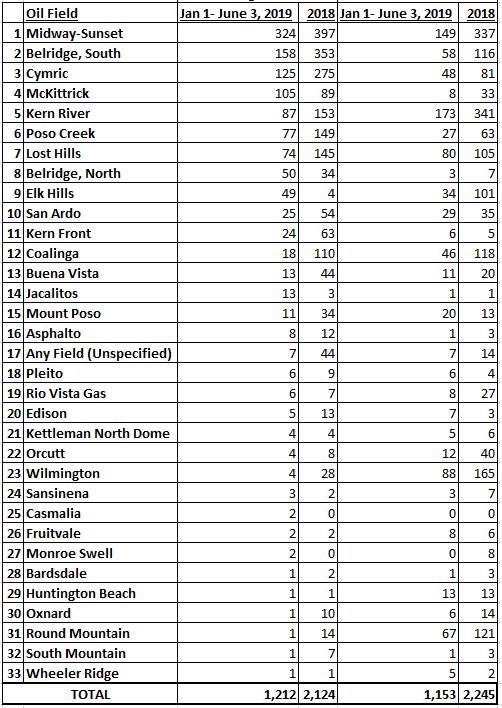
Data presented in Table 2 indicate which fields are being targeted for drilling and rework permits. While the 2019 data represents less than half the year, the number of drilling permits is almost equal to the total drilling permit count for 2018.

Majority players in the Midway-Sunset field are Berry Petroleum and Chevron. South Belridge is dominated by Aera Energy and Berry Petroleum. The Cymric field is mostly Chevron and Aera Energy; McKittrick is mostly Area Energy and Berry Petroleum. The Kern River field, which has by far the most reworks (most likely due to its massive size and age) is entirely Chevron.

Table 2. Permit Counts by Field

Conclusions

Be sure to also read the Consumer Watchdog report on FracTracker’s permit data!

The details of this analysis show that DOGGR has allowed for a modest increase in permits for oil and gas wells in 2019. The increase in well stimulations in 2019 is estimated to be larger, at 103.2%.

There was the consideration that this could be a seasonal phenomenon since we extrapolated from data encompassing just less than the first half of the year. But upon reviewing data for several other years, that does not seem to be the case. The general trend was instead increasing numbers of permits as each year progresses, with smaller permit counts through the first half of the year.

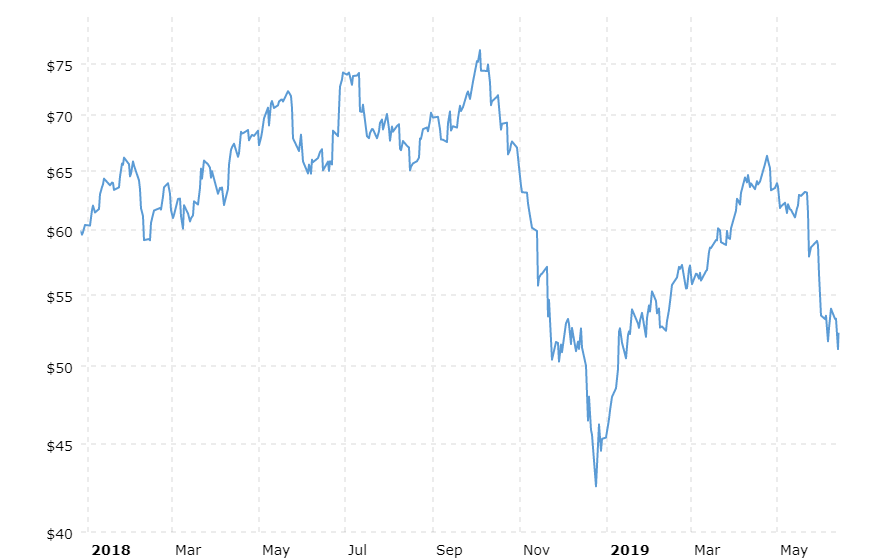
Oil prices do not provide much explanation either. The chart in Figure 3 shows that crude prices were higher in 2018 than they have been for the vast majority of 2019. The increase in permits could be the result of oil and gas operators like Chevron and Aera anticipating a stricter regulatory climate under Governor Newsom. Operators may be securing  as many permits as possible, while DOGGR is still liberally issuing them. This could be a consequence of the Governor’s recognition of the need for California to begin a managed decline of fossil fuel production and end oil drilling in California.

Could this be an early industry death rattle?

Figure 3. Crude prices in 2018 and 2019

By Kyle Ferrar, Western Program Coordinator, FracTracker Alliance

Urban Drilling in Los Angeles

Impact of a 2,500′ Oil and Gas Well Setback in California

Why does California need setbacks?

A new bill proposed by California State Assembly Member Al Muratsuchi (D), AB345, seeks to establish a minimum setback distance of 2,500′ between oil and gas wells and sensitive sites including occupied dwellings, schools, healthcare facilities, and playgrounds. A setback distance for oil and gas development is necessary from a public health standpoint, as the literature unequivocally shows that oil and gas wells and the associated infrastructure pose a significant risk to the communities that live near them.

FracTracker Alliance conducted a spatial analysis to understand the impact a 2,500’ well setback would have on oil and gas expansion in California. In a previous report, The Sky’s Limit California (Oil Change Internal, 2018), Fractracker data showed that 8,493 active or newly permitted oil and gas wells were located within a 2,500’ buffer of sensitive sites. At the time it was estimated that 850,000 Californians lived within the setback distance of at least one of these oil and gas wells.

This does not bode well for Californians, as a recently published FracTracker literature review found that health impacts resulting from living near oil and gas development include cancer, infant mortality, depression, pneumonia, asthma, skin-related hospitalizations, and other general health symptoms. Studies also showed that health impacts increased with the density of oil and gas development, suggesting that health impacts are dose dependent. Living closer to more oil and gas sites means you are exposed to more health-threatening contamination.

An established setback is therefore necessary to alleviate some of these health burdens carried by the most vulnerable Environmental Justice (EJ) communities. Health assessments by the Los Angeles County Department of Health and studies on ambient air quality near oil fields by Occidental College Researchers support the assumption that 2,500′ is the necessary distance to help alleviate the harsh conditions of degraded air quality. Living at a distance beyond 2,500′ from an oil and gas site does not mean you are not impacted by air and water contamination. Rather the concentrations of contaminants will be less harmful. In fact studies showed that health impacts increased with proximity to oil and gas, with associated impacts potentially experienced by communities living at distances up to 9.3 miles (Currie et al. 2017) and 10 miles (Whitworth et al. 2017).

Assembly Bill 345

This analysis assesses the potential impact of State Assembly member Al Muratsuchi’s Assembly Bill 345 on California’s oil and gas extraction and production. Specifically, AB345 establishes a minimum 2,500’ setback requirement for future oil and gas development. It does not however directly address existing oil and gas permits.

The bill includes the following stipulations and definitions:

  • All new oil and gas development, that is not on federal land, are required to be located at least 2,500′ from residences, schools, childcare facilities, playgrounds, hospitals, or health clinics.
  • In this case the redrilling of a previously plugged and abandoned oil or gas well or other rework operation is to be considered new oil and gas development.
  • “Oil and gas development” means exploration for and drilling production and processing of oil, gas or other gaseous and liquid hydrocarbons; the flowlines; and the treatment of waste associated with that exploration, drilling, production, and processing.
  • “Oil and gas development” also includes hydraulic fracturing and other stimulation activities.
  • “Rework operations” means operations performed in the well bore of an oil or gas well after the well is completed and equipped for production, done for the purpose of securing, restoring, or improving hydrocarbon production in the subsurface interval that is the open to production in the well bore.
  • The bill does not include routine repairs or well maintenance work.

Map

Figure 1. Map of Wells within a 2,500′ Setback Distance from Sensitive Receptor Sites. The map below shows the oil and gas wells and permits that fall within the 2,500′ setback distance from sensitive receptor sites.  Summaries of these well counts and discussions of these well types are included below as well.

Map of Wells within a 2,500′ Setback Distance from Sensitive Receptor Sites

View map fullscreen | How FracTracker maps work


Environmental Justice

The California Environmental Justice Alliance (CEJA) has just released their 2018 Environmental Justice Agency Assessment, which used FracTracker’s data and mapping to assess environmental equity in the state regulation of oil permitting and drilling. The report issued the Division of Oil, Gas, and Geothermal Resources (DOGGR) a failing grade of ‘F’. According to the report, “DOGGR is aware that the proposed locations of many drilling activities are in or near EJ communities, but approves permits irrespective of known health and safety risks associated with neighborhood drilling.”

FracTracker’s analysis of low income communities in Kern County shows the following:

  • There are 16,690 active oil and gas production wells located in census blocks with median household incomes of less than 80% of Kern’s area median income (AMI).
  • Therefore about 25% (16,690 out of 67,327 total) of Kern’s oil and gas wells are located within low-income communities.
  • Of these 16,690 wells, 5,364 of them are located within the 2,500′ setback distance from sensitive receptor sites such as schools and hospitals (32%) vs 13.1% for the rest of the state.

For more information on the breakdown of Kern County wells, see our informational table, here.

DOGGR wells

Using freshly published Division of Oil, Gas, and Geothermal Resources (DOGGR) data (6/3/19), we find that there are 9,835 active wells that fall within the 2,500’ setback distance, representing 13.1% of the total 74,775 active wells in the state.

There are 6,558 idle wells that fall within the 2,500’ setback distance, of nearly 30,000 total idle wells in the state. Putting these idle wells back online would be blocked if the wells require reworks to restart or ramp up production. For the most part operators do not intend for most idle wells to come back online. Rather operators are just avoiding the costs of plugging and properly abandoning the wells. To learn more about this issue, see our recent coverage of idle wells here.

Of the 3,783 permitted wells not yet in production, or “new wells,” 298 (7.8%) are located within the 2,500’ buffer zone.

Getting a count of plugged wells within the setback distance is more difficult because there is not a complete dataset, but there are over 30,000 wells in areas with active production that would be blocked from being redrilled. In total there are 122,209 plugged wells listed in the DOGGR database.

Permits

We also looked at permit applications that were approved in 2018, including permits for drilling new wells, well reworks, deepening wells and well sidetracks. This may be the most insightful of all the analyses.

Within the 2018 permit data, we find that 4,369 permits were approved. Of those 518 permits (about 12%) were granted within the proposed 2,500’ setback. Of the permits 25% were for new drilling, 73% were for reworks, and 2% were for deepening existing wells. By county, 42% were in Kern, 24% were in Los Angeles, 14% in Ventura, 6% in Santa Barbara, 3% in Fresno, and 2% or less in Glenn, Monterey, Sutter, San Joaquin, Colusa, Solano, Orange and Tehama, in descending order.

SCAQMD Notices

In LA, Rule 1148.2 requires operators to notify the South Coast Air Quality Management District (SCAQMD) of activities at well sites, including stimulations and reworks. These data points are reiterative of the “permits” discussed above, but the dataset is specific to the SCAQMD and includes additional activities. Of the 1,361 reports made to the air district since the beginning of 2018 through April 1, 2019; 634 (47%) were for wells that would be impacted by the setback distance; 412 incidences were for something other than “well maintenance” of which 348 were for gravel packing, 4 for matrix acidizing, and 65 were for well drilling. We are not sure where gravel packing falls, in reference to AB345.

A major consideration is that this rule may force many active wells into an idle status. If the onus of plugging wells falls on the state, these additional idle wells could be a major liability for the public. Fortunately AB1328 recently defined new idle well rules. The rules entice operators to plug and abandon idle wells. If rule 1328 is effective at reducing the stock of idle wells, these two bills could complement each other. (For more information on idle wells, read FracTracker’s recent analysis, here: https://fractracker.org/2019/04/idle-wells-are-a-major-risk/)

State Bill 4 Well Stimulation Reporting

We also analyzed data reported to DOGGR under the well stimulation requirements of CA State Bill 4 (SB4), the 2013 bill that set a framework for regulating hydraulic fracturing in California. Part of the bill required an independent scientific study to be conducted on oil and gas well stimulation, including acid well stimulation and hydraulic fracturing. Since 2016 operators have been required to secure special permits to stimulate wells, which includes hydraulic fracturing and several other techniques. To learn more about this state regulation read FracTracker’s coverage of SB4. From January 1, 2016 to April 1, 2019, there have been 576 well stimulation treatment permits granted under the SB4 regulations. Only 1 hydraulic fracturing event, permitted in Goleta, would have been impacted by a 2,500’ setback in 2018.

Support for AB345

After being approved by the CA Assembly Natural Resources Committee in a 7-6 vote, the bill did not make it up for a vote in the Senate Appropriations Committee during the 2019 legislative session.  The bill was described by the committee as “promising policies that need more time for discussion.” AB345 is now a two-year bill in the state Senate and will be reconsidered by the committee in January of 2020. The Chairperson of the Appropriations Committee, Lorena Gonzalez, indicated her general support for the policy and committed to working with the author to find a way to move the bill forward at the end of the session.

By Kyle Ferrar, Western Program Coordinator, FracTracker Alliance 

Feature image by David McNew, Getty Images

Release: The 2019 You Are Here map launches, showing New York’s hurdles to climate leadership

For Immediate Release

Contact: Lee Ziesche, lee@saneenergyproject.org, 954-415-6282

Interactive Map Shows Expansion of Fracked Gas Infrastructure in New York State

And showcases powerful community resistance to it

New York, NY – A little over a year after 55 New Yorkers were arrested outside of Governor Cuomo’s door calling on him to be a true climate leader and halt the expansion of fracked gas infrastructure in New York State, grassroots advocates Sane Energy Project re-launched the You Are Here (YAH) map, an interactive map that shows an expanding system of fracked infrastructure approved by the Governor.

“When Governor Cuomo announced New York’s climate goals in early 2019, it’s clear there is no room for more extractive energy, like fossil fuels.” said Kim Fraczek, Director of Sane Energy Project, “Yet, I look at the You Are Here Map, and I see a web of fracked gas pipelines and power plants trapping communities, poisoning our water, and contributing to climate change.”

Sane Energy originally launched the YAH map in 2014 on the eve of the historic People’s Climate March, and since then, has been working with communities that resist fracked gas infrastructure to update the map and tell their stories.

“If you read the paper, you might think Governor Cuomo is a climate leader, but one look at the YAH Map and you know that isn’t true. Communities across the state are living with the risks of Governor Cuomo’s unprecedented buildout of fracked gas infrastructure,” said Courtney Williams, a mother of two young children living within 400 feet of the AIM fracked gas pipeline. “The Governor has done nothing to address the risks posed by the “Algonquin” Pipeline running under Indian Point Nuclear Power Plant. That is the center of a bullseye that puts 20 million people in danger.”

Fracked gas infrastructure poses many of the same health risks as fracking and the YAH map exposes a major hypocrisy when it comes to Governor Cuomo’s environmental credentials. The Governor has promised a Green New Deal for New York, but climate science has found the expansion of fracking and fracked gas infrastructure is increasing greenhouse gas emissions in the United States.

“The YAH map has been an invaluable organizing tool. The mothers I work with see the map and instantly understand how they are connected across geography and they feel less alone. This solidarity among mothers is how we build our power ,” said Lisa Marshall who began organizing with Mothers Out Front to oppose the expansion of the Dominion fracked gas pipeline in the Southern Tier and a compressor station built near her home in Horseheads, New York. “One look at the map and it’s obvious that Governor Cuomo hasn’t done enough to preserve a livable climate for our children.”

“Community resistance beat fracking and the Constitution Pipeline in our area,” said Kate O’Donnell  of Concerned Citizens of Oneonta and Compressor Free Franklin. “Yet smaller, lesser known infrastructure like bomb trucks and a proposed gas decompressor station and 25 % increase in gas supply still threaten our communities.”

The YAH map was built in partnership with FracTracker, a non-profit that shares maps, images, data, and analysis related to the oil and gas industry hoping that a better informed public will be able to make better informed decisions regarding the world’s energy future.

“It has been a privilege to collaborate with Sane Energy Project to bring our different expertise to visualizing the extent of the destruction from the fossil fuel industry. We look forward to moving these detrimental projects to the WINS layer, as communities organize together to take control of their energy future. Only then, can we see a true expansion of renewable energy and sustainable communities,” said Karen Edelstein, Eastern Program Coordinator at Fractracker Alliance.

Throughout May and June Sane Energy Project and 350.org will be traveling across the state on the ‘Sit, Stand Sing’ tour to communities featured on the map to hold trainings on nonviolent direct action and building organizing skills that connect together the communities of resistance.

“Resistance to fracking infrastructure always starts with small, volunteer led community groups,” said Lee Ziesche, Sane Energy Community Engagement Coordinator. “When these fracked gas projects come to town they’re up against one of the most powerful industries in the world. The You Are Here Map and ‘Sit, Stand Sing’ tour will connect these fights and help build the power we need to stop the harm and make a just transition to community owned renewable energy.”