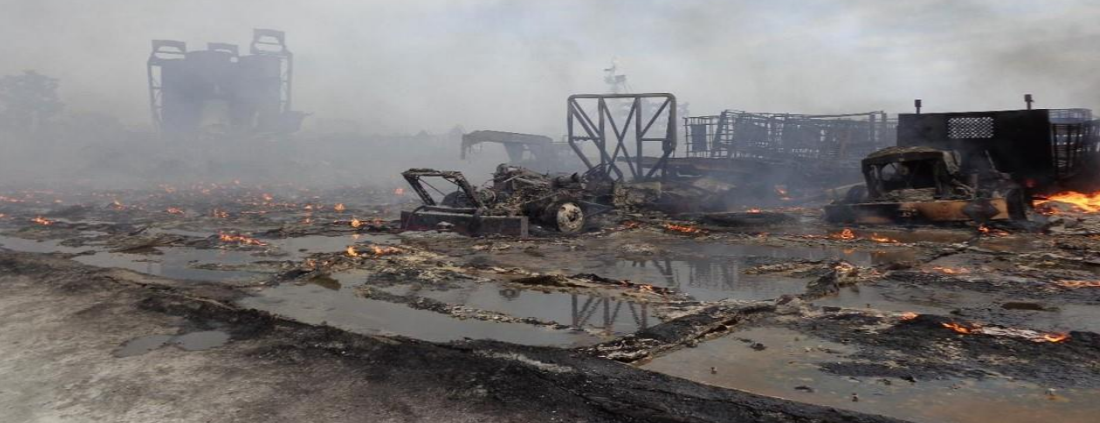
Incinerators: Dinosaurs in the world of energy generation


In this article, we’ll take a look at the current trend in “re-branding” incineration as a viable option to deal with the mountains of garbage generated by our society. Incineration can produce energy for electricity, but can the costs—both economically, and ecologically—justify the benefits? What are the alternatives?

Changes in our waste stream

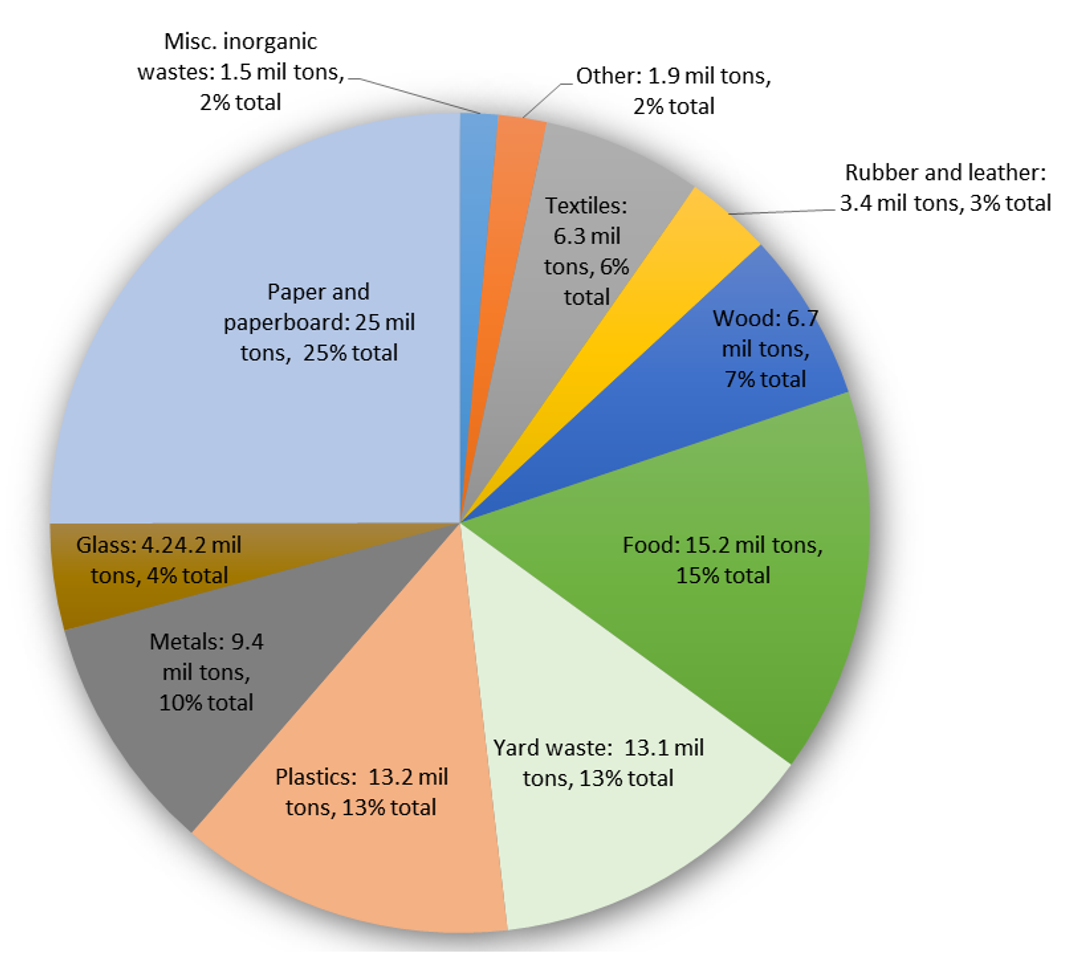
In today’s world of consumerism and production, waste disposal is a chronic problem facing most communities worldwide. Lack of attention to recycling and composting, as well as ubiquitous dependence on plastics, synthetics, and poorly-constructed or single-use goods has created a waste crisis in the United States. So much of the waste that we create could be recycled or composted, however, taking extraordinary levels of pressure off our landfills. According to estimates in 2017 by the US Environmental Protection Agency (EPA), over 30 percent of municipal solid waste is made up of organic matter like food waste, wood, and yard trimmings, almost all of which could be composted. Paper, glass, and metals – also recyclable – make up nearly 40 percent of the residential waste stream. Recycling plastic, a material which comprises 13% of the waste stream, has largely been a failed endeavor thus far.

Why say NO to incinerators?
  • They are bad for the environment, producing toxic chlorinated byproducts like dioxins. Incineration often converts toxic municipal waste into other forms, some of which are even more toxic than their precursors.
  • They often consume more energy than they produce and are not profitable to run.
  • They add CO2 to the atmosphere.
  • They promote the false narrative that we can “get something” from our trash
  • They detract from the conversation about actual renewable energy sources like wind power, solar power, and geothermal energy that will stop the acceleration of climate chaos.

Figure 1: A breakdown of the 267.78 million tons of municipal waste that were generated in the US in 2017. Source: figure developed by FracTracker Alliance, based on 2017 EPA data. Source: https://www.epa.gov/facts-and-figures-about-materials-waste-and-recycling/national-overview-facts-and-figures-materials

Nevertheless, of the approximately 400 million tons of plastic produced annually around the world, only about 10% of it is recycled. The rest winds up in the waste stream or as microfragments (or microplastics) in our oceans, freshwater lakes, and streams.

Figure 2: Increase in global plastics production, 1950-2015, Source: Geyer, R., Jambeck, J. R., & Law, K. L. (2017). Production, use, and fate of all plastics ever made. Science Advances, 3(7), e1700782. Available at: http://advances.sciencemag.org/content/3/7/e1700782 Referenced in https://ourworldindata.org/plastic-pollution

According to an EPA fact sheet, by 2017, municipal solid waste generation increased three-fold compared with 1960. In 1960, that number was 88.1 million tons. By 2017, this number had risen to nearly 267.8 million tons. Over that same period, per-capita waste generation rose from 2.68 pounds per person per day, to 4.38 pounds per person per day, as our culture became more wed to disposable items.

The EPA provides a robust “facts and figures” breakdown of waste generation and disposal here.  In 2017, 42.53 million tons of US waste was shipped to landfills, which are under increasing pressure to expand and receive larger and larger loads from surrounding area, and, in some cases, hundreds of miles away.

How are Americans doing in reducing waste?

On average, in 2017, Americans recycled and composted 35.2% of our individual waste generation rate of 4.51 pounds per person per day.  While this is a notable jump from decades earlier, much of the gain appears to be in the development of municipal yard waste composting programs. Although the benefits of recycling are abundantly clear, in today’s culture, according to a PEW Research Center report published in 2016, just under 30% of Americans live in communities where recycling is strongly encouraged. An EPA estimate for 2014 noted that the recycling rate that year was only 34.6%, nationwide, with the highest compliance rate at 89.5% for corrugated boxes.
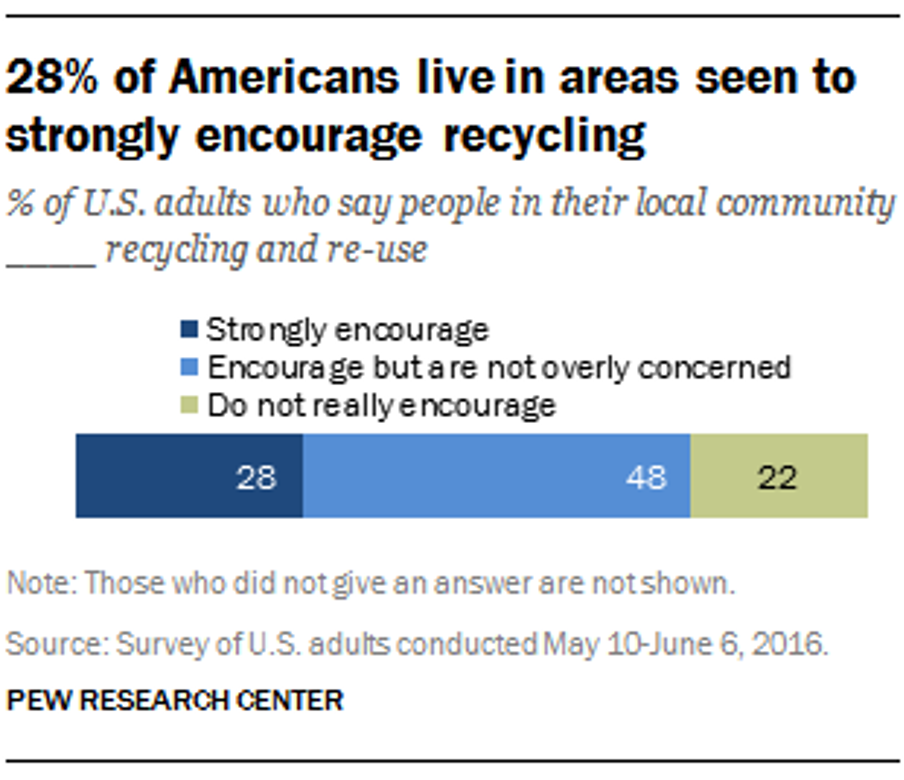
Figure 3. Percent of Americans who report recycling and re-use behaviors in their communities, via Pew Research center
Historically, incineration – or burning solid waste – has been one method for disposing of waste. And in 2017, this was the fate of 34 million tons—or nearly 13%– of all municipal waste generated in the United States. Nearly a quarter of this waste consisted of containers and packaging—much of that made from plastic.  The quantity of packaging materials in the combusted waste stream has jumped from only 150,000 tons in 1970 to 7.86 million tons in 2017.  Plastic, in its many forms, made up 16.4% of all incinerated materials, according to the EPA’s estimates in 2017.
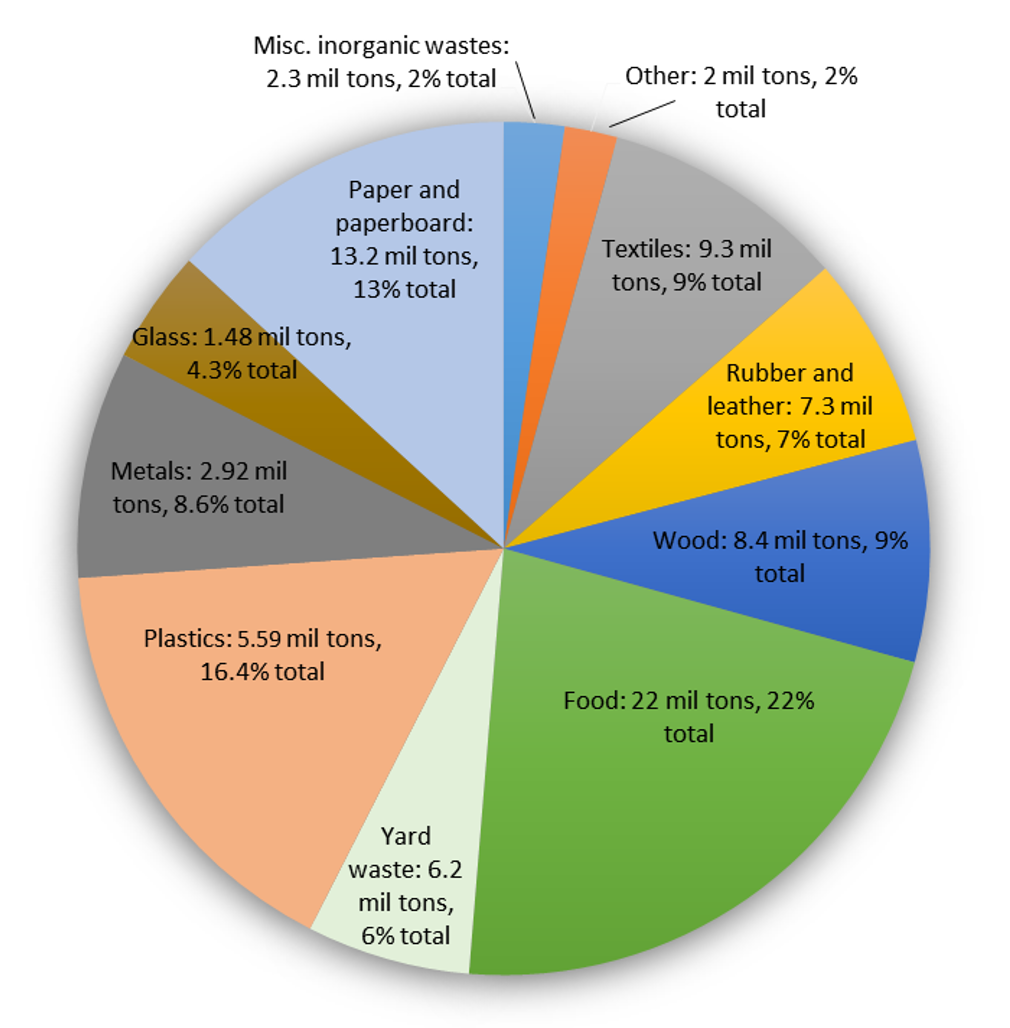
Figure 4: A breakdown of the 34.03 tons of municipal waste incinerated for energy in the US in 2017

What is driving the abundance of throw-away plastics in our waste stream?

Sadly, the answer is this: The oil and gas industry produces copious amounts of ethane, which is a byproduct of oil and gas extraction. Plastics are an “added value” component of the cycle of fossil fuel extraction. FracTracker has reported extensively on the controversial development of ethane “cracker” plants, which chemically change this extraction waste product into feedstock for the production of polypropylene plastic nuggets. These nuggets, or “nurdles,” are the building blocks for everything from fleece sportswear, to lumber, to packaging materials. The harmful impacts from plastics manufacturing on air and water quality, as well as on human and environmental health, are nothing short of stunning.

FracTracker has reported extensively on this issue. For further background reading, explore:

A report co-authored by FracTracker Alliance and the Center for Environmental Integrity in 2019 found that plastic production and incineration in 2019 contributed greenhouse gas emissions equivalent to that of 189 new 500-megawatt coal power plants. If plastic production and use grow as currently planned, by 2050, these emissions could rise to the equivalent to the emissions released by more than 615 coal-fired power plants.
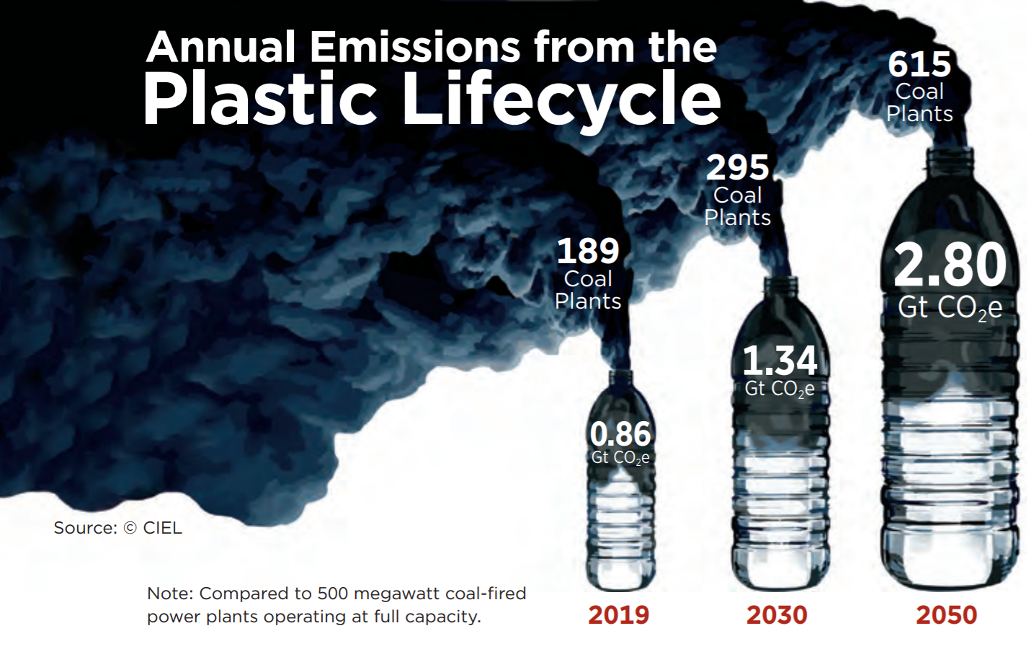
Figure 5: Projected carbon dioxide equivalencies in plastics emissions, 2019-2050. Source: Plastic and Climate https://www.ciel.org/plasticandclimate/

Just another way of putting fossil fuels into our atmosphere

Incineration is now strongly critiqued as a dangerous solution to waste disposal as more synthetic and heavily processed materials derived from fossils fuels have entered the waste stream. Filters and other scrubbers that are designed to remove toxins and particulates from incineration smoke are anything but fail-safe. Furthermore, the fly-ash and bottom ash that are produced by incineration only concentrate hazardous compounds even further, posing additional conundrums for disposal.

Incineration as a means of waste disposal, in some states is considered a “renewable energy” source when electricity is generated as a by-product. Opponents of incineration and the so-called “waste-to-energy” process see it as a dangerous route for toxins to get into our lungs, and into the food stream. In fact, Energy Justice Network sees incineration as:

… the most expensive and polluting way to make energy or to manage waste. It produces the fewest jobs compared to reuse, recycling and composting the same materials. It is the dirtiest way to manage waste – far more polluting than landfills. It is also the dirtiest way to produce energy – far more polluting than coal burning.

Municipal waste incineration: bad environmentally, economically, ethically

Waste incineration has been one solution for disposing of trash for millennia. And now, aided by technology, and fueled by a crisis to dispose of ever-increasing trash our society generates, waste-to-energy (WTE) incineration facilities are a component in how we produce electricity.

But what is a common characteristic of the communities in which WTEs are sited? According to a 2019 report by the Tishman Environmental and Design Center at the New School, 79% of all municipal solid waste incinerators are located in communities of color and low-income communities.  Incinerators are not only highly problematic environmentally and economically. They present direct and dire environmental justice threats.

Waste-to-Energy facilities in the US, existing and proposed

Click here to view this map full-screen

Activate the Layers List button to turn on Environmental Justice data on air pollutants and cancer occurrences across the United States.  We have also included real-time air monitoring data in the interactive map because one of the health impacts of incineration includes respiratory illnesses. These air monitoring stations measure ambient particulate matter (PM 2.5) in the atmosphere, which can be a helpful metric.

What are the true costs of incineration?

These trash incinerators capture energy released from the process of burning materials, and turn it into electricity. But what are the costs? Proponents of incineration say it is a sensible way to reclaim or recovery energy that would otherwise be lost to landfill disposal. The US EIA also points out that burning waste reduces the volume of waste products by up to 87%.

The down-side of incineration of municipal waste, however, is proportionally much greater, with a panoply of health effects documented by the National Institutes for Health, and others.

Dioxins (shown in Figures 6-11) are some of the most dangerous byproducts of trash incineration. They make up a group of highly persistent organic pollutants that take a long time to degrade in the environment and are prone to bioaccumulation up the food chain.

Dioxins are known to cause cancer, disrupt the endocrine and immune systems, and lead to reproductive and developmental problems. Dioxins are some of the most dangerous compounds produced from incineration. Compared with the air pollution from coal-burning power plants, dioxin concentrations produced from incineration may be up to 28 times as high.
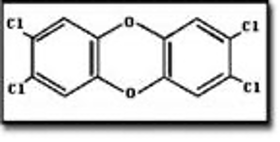
2,3,7,8-Tetrachlorodibenzo-p-dioxin
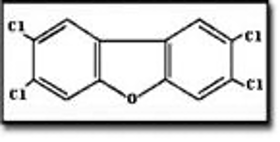
2,3,7,8-Tetrachlorodibenzofuran
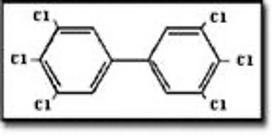
3,3′,4,4′,5,5′-Hexachlorobiphenyl
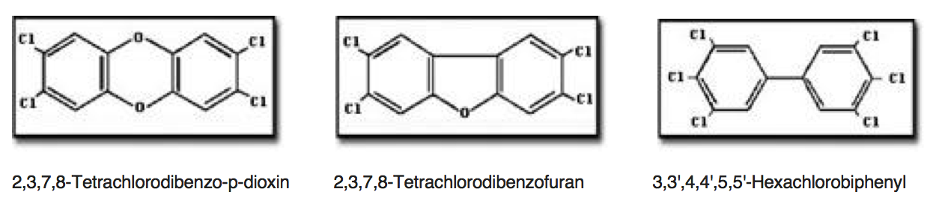
Figures 6-11: Dioxin chemical structures via US EPA. Source: https://www.epa.gov/dioxin/learn-about-dioxin
 

Federal EPA regulations between 2000 and 2005 resulted in the closure of nearly 200 high dioxin emitting plants. Currently, there are fewer than 100 waste-to-energy incinerators operating in the United States, all of which are required to operate with high-tech equipment that reduces dioxins to 1% of what used to be emitted. Nevertheless, even with these add-ons, incinerators still produce 28 times the amount of dioxin per BTU when compared with power plants that burn coal.

Even with pollution controls required of trash incinerators since 2005, compared with coal-burning energy generation, incineration still releases 6.4 times as much of the notoriously toxic pollutant mercury to produce the equivalent amount of energy.

Energy Justice Network, furthermore, notes that incineration is the most expensive means of managing waste… as well as making energy. This price tag includes high costs to build incinerators, as well as staff and maintain them — exceeding operation and maintenance costs of coal by a factor of 11, and nuclear by a factor of 4.2.
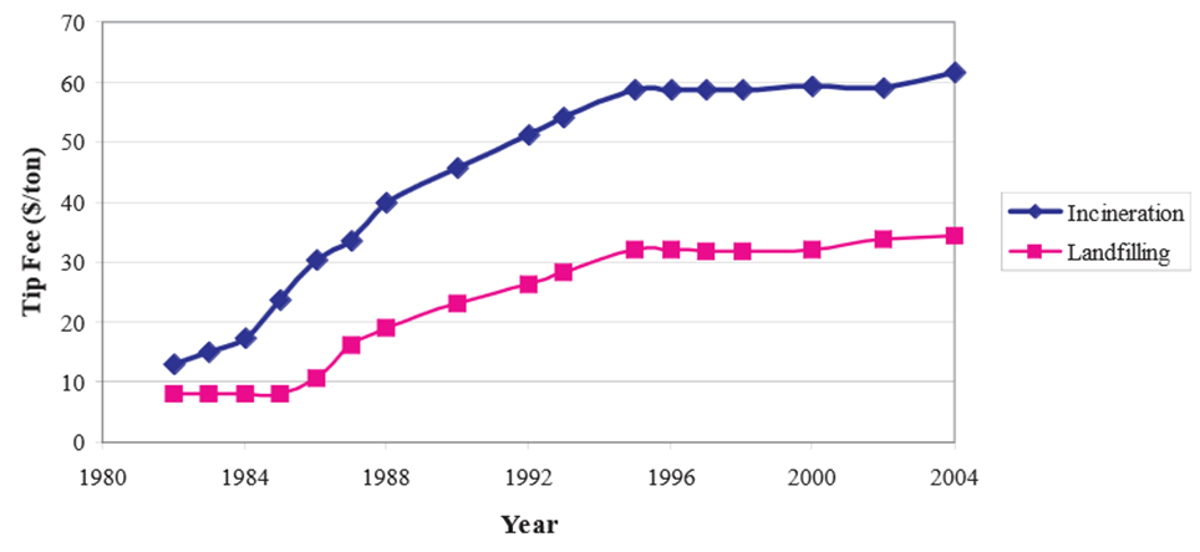
Figure 12. Costs of incineration per ton are nearly twice that of landfilling. Source: National Solid Waste Management Association 2005 Tip Fee Survey, p. 3.
Energy Justice Network and others have pointed out that the amount of energy recovered and/or saved from recycling or composting is up to five times that which would be provided through incineration.
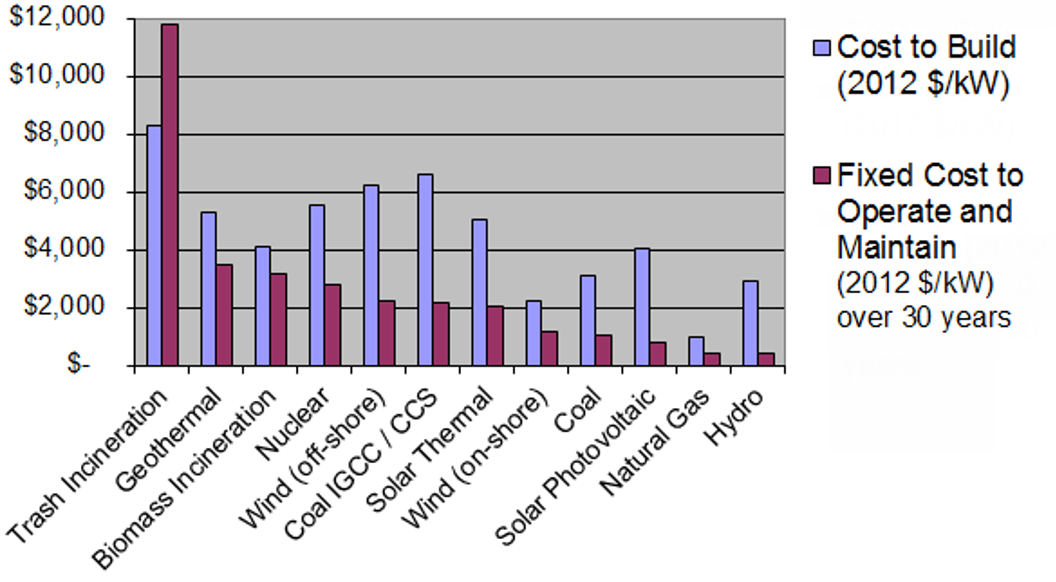
Figure 13. Estimated power plant capital and operating costs. Source: Energy Justice Network

The myth that incineration is a form of “renewable energy”

Waste is a “renewable” resource only to the extent that humans will continue to generate waste. In general, the definition of “renewable” refers to non-fossil fuel based energy, such as wind, solar, geothermal, wind, hydropower, and biomass. Synthetic materials like plastics, derived from oil and gas, however, are not. Although not created from fossil fuels, biologically-derived products are not technically “renewable” either.

ZeroWasteEurope argues that:

Biogenic materials you find in the residual waste stream, such as food, paper, card and natural textiles, are derived from intensive agriculture – monoculture forests, cotton fields and other “green deserts”. The ecosystems from which these materials are derived could not survive in the absence of human intervention, and of energy inputs from fossil sources. It is, therefore, more than debatable whether such materials should be referred to as renewable.

Although incineration may reduce waste volumes by up to 90%, the resulting waste-products are problematic. “Fly-ash,” which is composed of the light-weight byproducts, may be reused in concrete and wallboard. “Bottom ash” however, the more coarse fraction of incineration—about 10% overall—concentrates toxins like heavy metals. Bottom-ash is disposed of in landfills or sometimes incorporated into structural fill and aggregate road-base material.

How common is the practice of using trash to fuel power plants?

Trash incineration accounts for a fraction of the power produced in the United States. According to the United States Energy Information Administration, just under 13% of electricity generated in the US comes from burning of municipal solid waste, in fewer than 65 waste-to-energy plants nation-wide. Nevertheless, operational waste-to-incineration plants are found throughout the United States, with a concentration east of the Mississippi.

According to EnergyJustice.net’s count of waste incinerators in the US and Canada, currently, there are:

    • 88 operating
    • 41 proposed
    • 0 expanding
    • 207 closed or defeated

Figure 14. Locations of waste incinerators that are already shut down. Source: EnergyJustice.net)
Precise numbers of these incinerators are difficult to ascertain, however. Recent estimates from the federal government put the number of current waste-to-energy facilities at slightly fewer: EPA currently says there are 75 of these incinerators in the United States. And in their database, updated July 2020, the United States Energy Information Administration (EIA), lists 63 power plants that are fueled by municipal solid waste. Of these 63 plants, 40—or 66%—are in the northeast United States.

Regardless, advocates of clean energy, waste reduction, and sustainability argue that trash incinerators, despite improvements in pollution reduction over earlier times and the potential for at least some electric generation, are the least effective option for waste disposal that exists. The trend towards plant closure across the United States would support that assertion.

Let’s take a look at the dirty details on WTE facilities in three states in the Northeastern US.

Review of WTE plants in New York, Pennsylvania, and New Jersey

A. New York State

In NYS, there are currently 11 waste-to-energy facilities that are operational, and two that are proposed. Here’s a look at some of them:

The largest waste-to-energy facility in New York State, Covanta Hempstead Company (Nassau County), was built in 1989. It is a 72 MW generating plant, and considered by Covanta to be the “cornerstone of the town’s integrated waste service plan.”

According to the Environmental Protection Agency’s ECHO database, this plant has no violations listed. Oddly enough, even after drawing public attention in 2009 about the risks associated with particulate fall-out from the plant, the facility has not been inspected in the past 5 years.

Other WTE facilities in New York State include the Wheelabrator plant located in Peekskill (51 MW), Covanta Energy of Niagara in Niagara Falls (32 MW), Convanta Onondaga in Jamesville (39 MW), Huntington Resource Recovery in Suffolk County (24.3 MW), and the Babylon Resource Recovery Facility also in Suffolk County (16.8 MW). Five additional plants scattered throughout the state in Oswego, Dutchess, Suffolk, Tioga, and Washington Counties, are smaller than 15 MW each. Of those, two closed and one proposal was defeated.

B. Pennsylvania

In Pennsylvania, six WTE facilities are currently operating. Two have been closed, and six defeated.

C. New Jersey

And in New Jersey, there are currently four operating WTE facilities. Essex County Resource Recovery Facility, is New Jersey’s largest WTE facility. It opened in 1990, houses three burners, and produces 93 MW total.

Union County Resource Recovery Facility, which opened in 1994, operates three burners, producing 73 MW total. Covanta Camden Energy Recovery Center opened in 1991. It has 13 burners, producing a total of 46 MW. Wheelabrator Gloucester LP (Westville, NJ) opened in 1990. The two burners there produce 21 MW of power. Covanta Warren Energy is the oldest and smallest WTE facility in New Jersey. It produced 14 MW of energy and opened in 1988. Operations are currently shut down, but this closure may not be permanent.

Throw-aways, burn-aways, take-aways

Looming large above the arguments about appropriate siting, environmental justice, financial gain, and energy prices, is a bigger question:

How can we continue to live on this planet at our current rates of consumption, and the resultant waste generation?

The issue here is not so much about the sources of our heat and electricity in the future, but rather “How MUST we change our habits now to ensure a future on a livable planet?”

Professor Paul Connett (emeritus, St. Lawrence University), is a specialist in the build-up of dioxins in food chains, and the problems, dangers, and alternatives to incineration. He is a vocal advocate for a “Zero Waste” approach to consumption, and suggests that every community embrace these principles as ways to guide a reduction of our waste footprint on the planet. The fewer resources that are used, the less waste is produced, mitigating the extensive costs brought on by our consumptive lifestyles. Waste-to-energy incineration facilities are just a symptom of our excessively consumptive society.

Dr. Connett suggests these simple but powerful methods to drastically reduce the amount of materials that we dispose — whether by incineration, landfill, or out the car window on a back-road, anywhere in the world:

    • Source separation
    • Recycling
    • Door-to-door collection
    • Composting
    • Building Reuse, Repair and Community centers
    • Implementing waste reduction Initiatives
    • Building Residual Separation and Research centers
    • Better industrial design
    • Economic incentives
    • Interim landfill for non-recyclables and biological stabilization of other organic materials

Connett’s Zero Waste charge to industry is this: “If we can’t reuse, recycle, or compost it, industry shouldn’t be making it.” Reducing our waste reduces our energy footprint on the planet.

In a similar vein, FracTracker has written about the potential for managing waste through a circular economics model, which has been successfully implemented by the city of Freiburg, Germany. A circular economic model incorporates recycling, reuse, and repair to loop “waste” back into the system. A circular model focuses on designing products that last and can be repaired or re-introduced back into a natural ecosystem.
 

This is an important vision to embrace. Every day. Everywhere.

Recommended resources

Figure 17: Illustration of common waste streams from “The Story of Plastic” (https://www.storyofplastic.org/)

By Karen Edelstein, Eastern Program Coordinator

Support this work

`

DONATE

Stay in the know

New York State Closes the Fracking Waste Loophole

Overview

On August 3, 2020, New Yorkers rejoiced in Governor Cuomo’s signing of legislation to protect the Empire State from Pennsylvania’s fracking waste. Although New York State has banned high-volume, horizontal hydraulic fracturing, or “fracking” within its borders, a fracking waste loophole allowed numerous landfills to received both solid and liquid waste products from drilling operations just south of its border, according to records from the Pennsylvania Department of Environmental Protection (PA DEP).

What has been at stake

A regulatory loophole in New York State’s laws exempted drilling waste from scrutiny as hazardous materials. Therefore, solid and liquid wastes from drilling operations — including many constituents which are considered secret or “proprietary” — were sent to landfills, and in some cases, spread on roads and walkways in the state. Municipalities were provided with very little understanding of the risks those materials might be posing to air and water quality in and around landfills. Until the signing of this legislation, New York State Department of Environmental Conservation has considered road-spreading of waste brine from both conventional and unconventional oil and gas wells that was spread on roads a “BUD,” or a beneficial use determination.

Nevertheless, research has shown that produced water from fracking operations can contain tens to thousands of times the allowable drinking water concentration limit of radium, strontium, barium, lead, arsenic, and other elements. Human health impacts of all phases of drilling operations were explored in a recent paper by Wollin et al. (May 2020).

Water that flows to the surface from oil and gas wells, so-called ‘produced water’, represents a mixture of flow-back, the injected frac fluid returning to the surface, and the reservoir water present in natural oil and gas deposits. Among numerous hazardous compounds, produced water may contain bromide, arsenic, strontium, mercury, barium, radioactive isotopes and organic compounds, particularly benzene, toluene, ethylbenzene and xylenes (BTEX). The sewage outflow, even from specialized treatment plants, may still contain critical concentrations of barium, strontium and arsenic. Evidence suggests that the quality of groundwater and surface water may be compromised by disposal of produced water.

Carcinogenic and radioactive wastes that are brought to the surface with both conventional and unconventional drilling technologies can have toxic impacts on human health and the natural environment, impacting the endocrine, nervous, cardiovascular, and respiratory systems, as well as air and water quality. According to the Natural Resources Defense Council, more than 75 percent of the chemicals used in fracking are associated with harm to human organs, while 25 percent are tied to cancer and other genetic mutations.

How could this be allowed?

Although the federal Resource Conservation and Recovery Act (RCRA)—passed in 1976—specifically safeguards human and environmental health, an amendment to the Act in 1980 exempted from regulation all waste from oil and gas exploration, development, and production. Despite close to 40 years of federal oversight of pollution created by countless industries, oil and gas operations have been subject to far more lax regulations. And although states can pass their own regulations to supplement the federal rule-making, this had not occurred in New York State.

The lead-up to the legislation

The recent legislation to close the fracking loophole in New York State was sponsored in 2019 by Senator Rachel May and Assemblyman Steve Engelbright. Lawmakers had been deadlocked on the issue since 2011, but through much hard work, political and public will, and a favorable complement of elected officials, after the bills finally passed both the New York State Senate and Assembly, they could move to Governor Andrew Cuomo’s desk, where they were signed into law in early August, 2020. According to EarthWorks, all oil and gas waste will be

  • Subject to laboratory analysis to determine whether it has the characteristics of hazardous waste (i.e., ignitability, corrosivity, reactivity, and toxicity)
  • Subject wastes to clearer, stronger management regulations like processing, tracking and marking of loads, recordkeeping with a manifest system, reporting to DEC, and specific requirements for clean up in the case of a spill

In addition, the law ensures that waste is disposed of only at facilities equipped to safely handle it.

Now, even wastes like brine from conventional drilling operations must undergo laboratory analysis to determine whether they have characteristics consistent with hazardous materials.

Here’s a look back at our history of accepting fracking waste from Pennsylvania into New York State.

Visualizing a long history of oil and gas waste coming to New York State from Pennsylvania

FracTracker has annually mapped the flow of drilling waste from Pennsylvania to New York State.

To view the map a full screen, click here


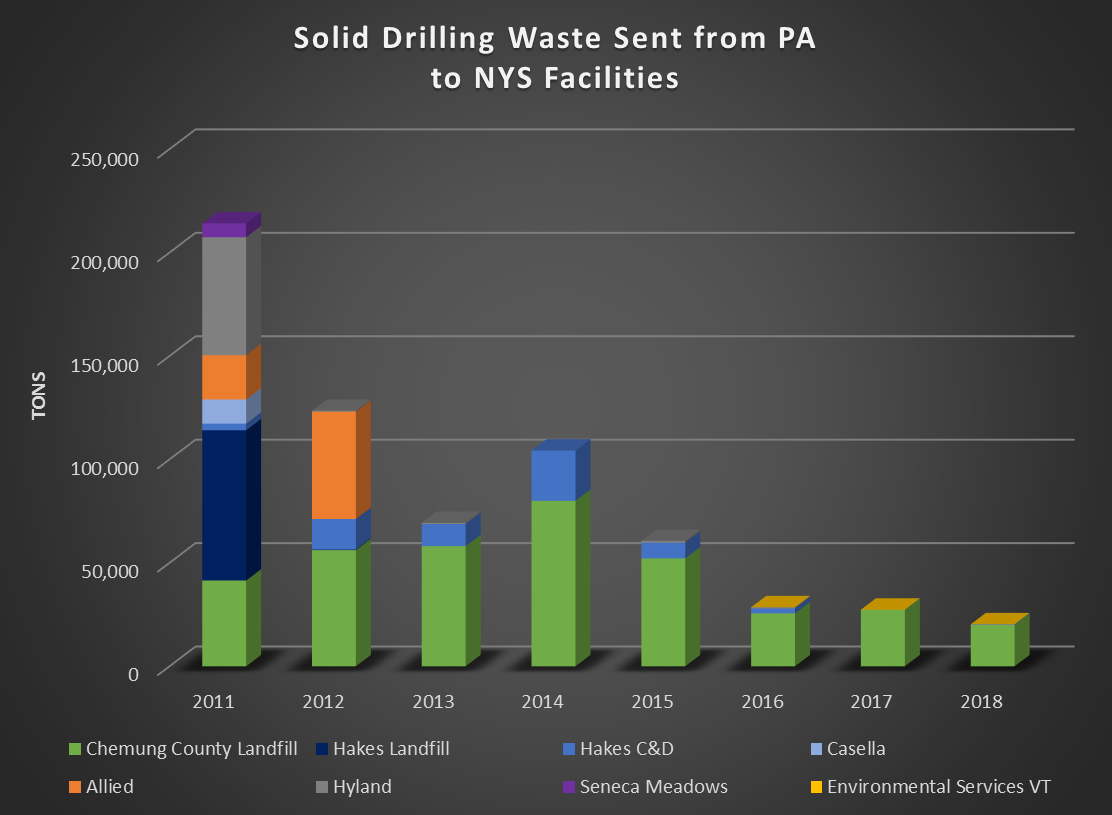
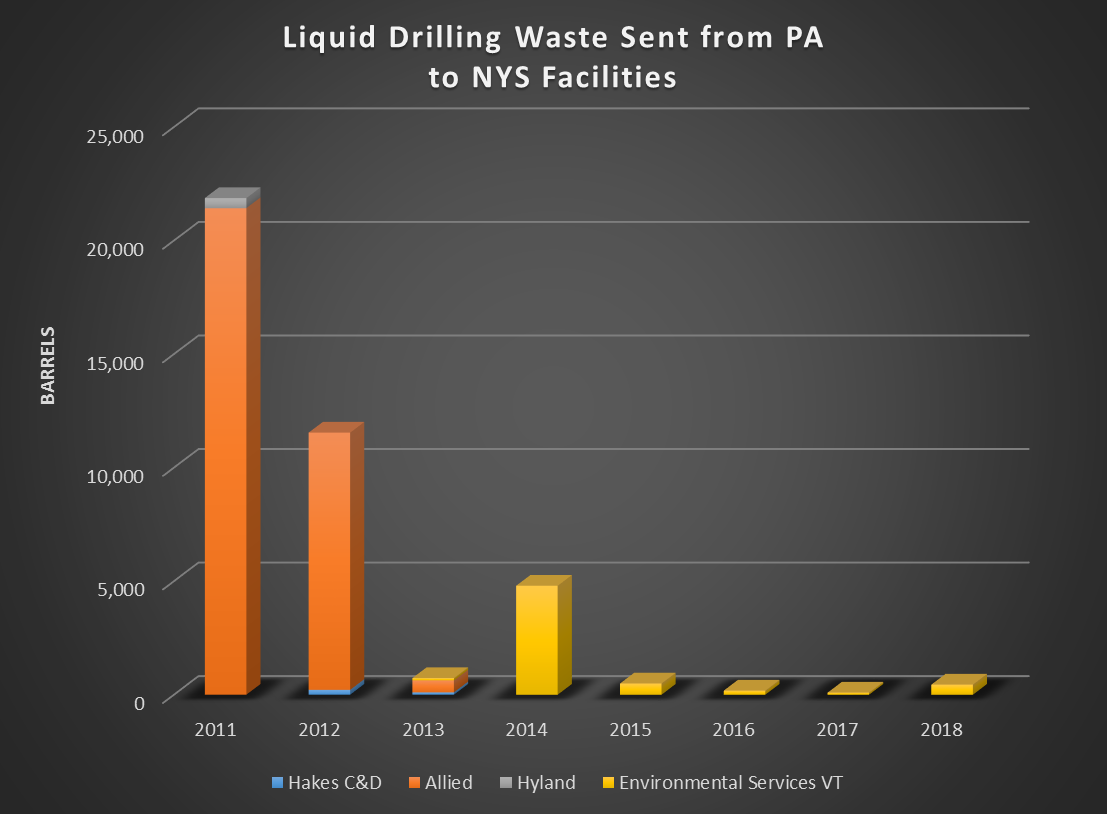
Since 2011, nearly 29,000 barrels of fracking liquid waste (drilling fluids, fracturing fluids, produced waters, etc.), along with close to 645,000 tons of solid waste (drill cuttings—some of it radioactive, sludge, contaminated soils, etc.) from Pennsylvania drilling operations have been disposed of in New York State. For more references on radioactivity in drilling materials, explore this resource. Drilling waste reports available from 2010 through the present show a steady decline in waste sent to New York State, beginning in 2011. Nonetheless, New York’s landfills have received as much as 11,548 barrels of drilling waste, and 214,168 tons of solid waste in a given year.

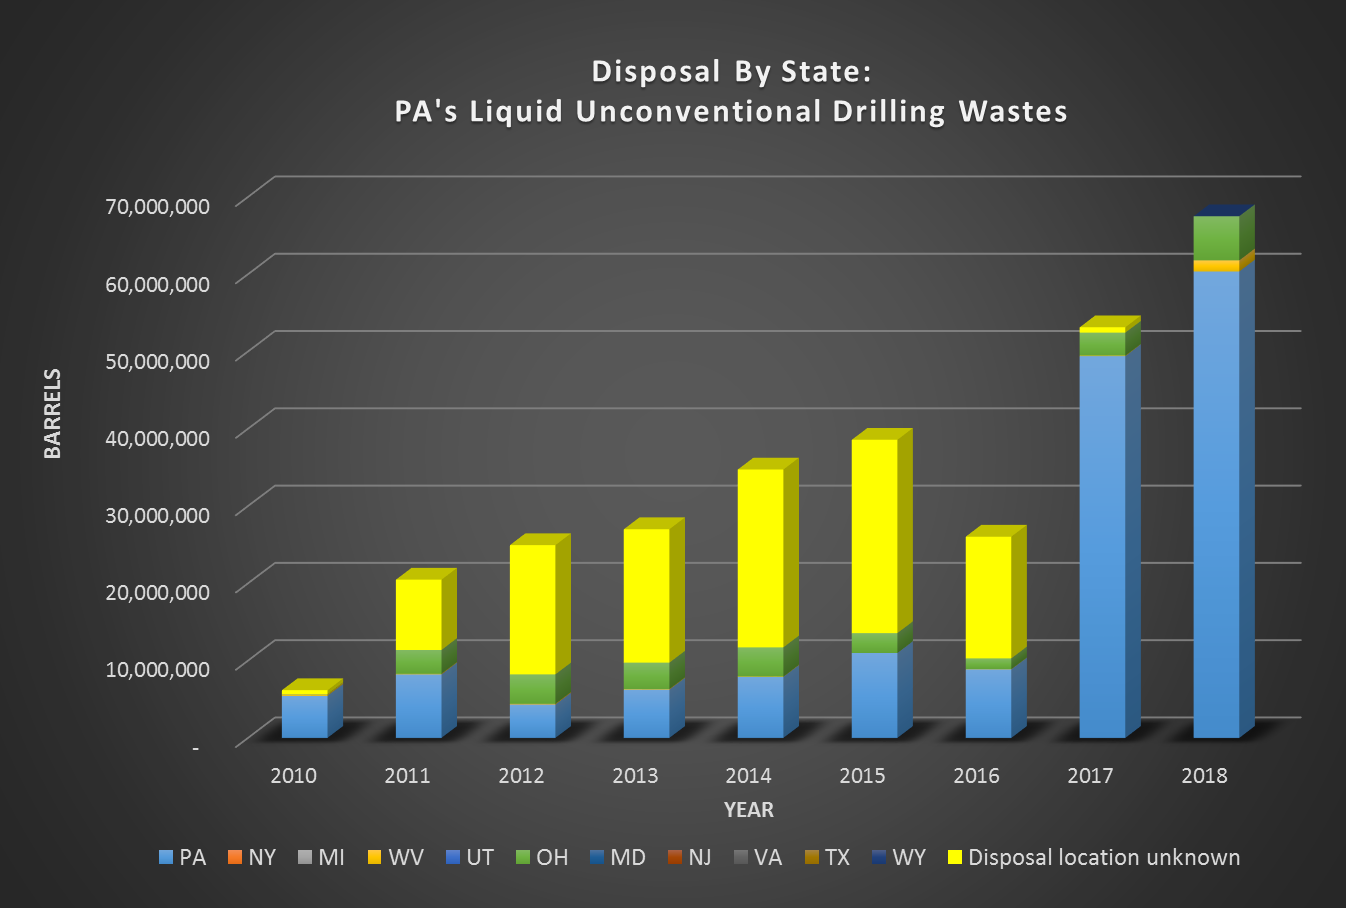
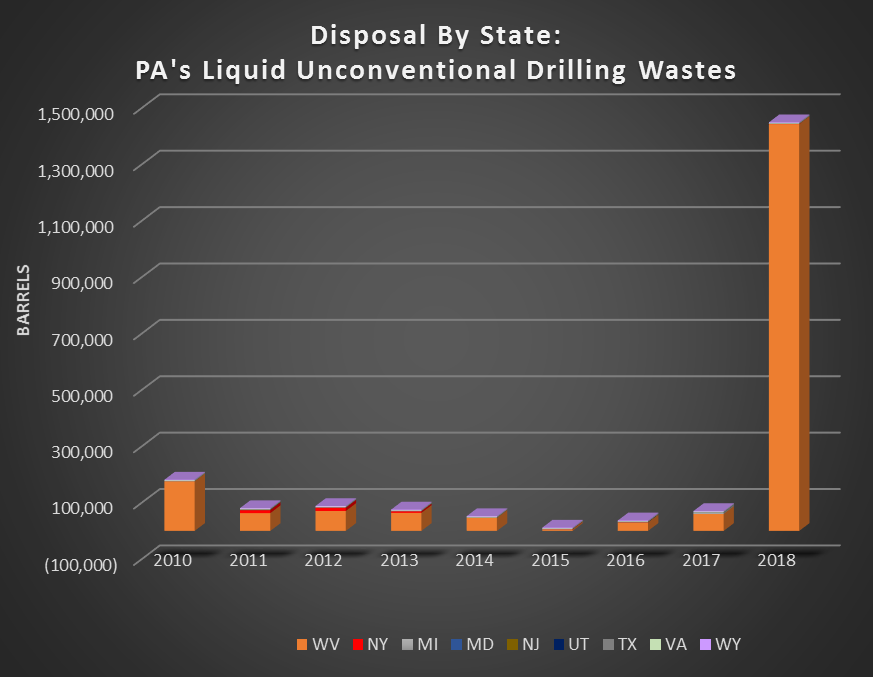
PA DEP’s records are far from complete prior to 2016, however, with disposal destinations unknown for close to 2/3 of liquid waste (see yellow portions of the bar chart in Figure 1) generated between 2012 and 2015.


Figure 1. Pennsylvania’s liquid unconventional drilling waste disposal by state, 2010-2019


In more recent years, waste products were accounted for more accurately, as well as shipped to injection wells in Ohio.

On a relatively smaller scale, one can also see how West Virginia’s acceptance of Pennsylvania’s fracking waste has skyrocketed in 2018 and 2019, particularly in comparison to states other than Pennsylvania and Ohio (Figure 2).


Figure 2. Pennsylvania’s liquid unconventional drilling waste disposal by state (excluding Pennsylvania and Ohio), 2010-2019


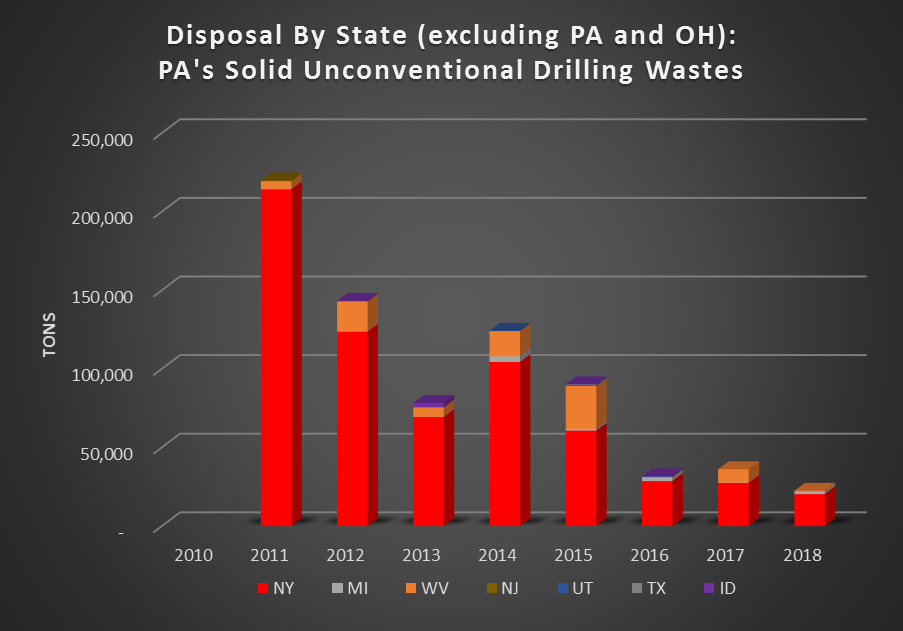
In general, records indicate more solid waste disposal occurring within Pennsylvania over time, with Ohio accepting varying quantities from year to year, and New York State steadily receiving less over time (Figure 3).


Figure 3. Pennsylvania’s solid unconventional drilling waste disposal by state, 2010-2019


Now that the regulatory loophole has been closed, these numbers should drop to near zero. Data about waste coming from Pennsylvania to New York in the first half of 2020 support that assertion (Figures 4 and 5).


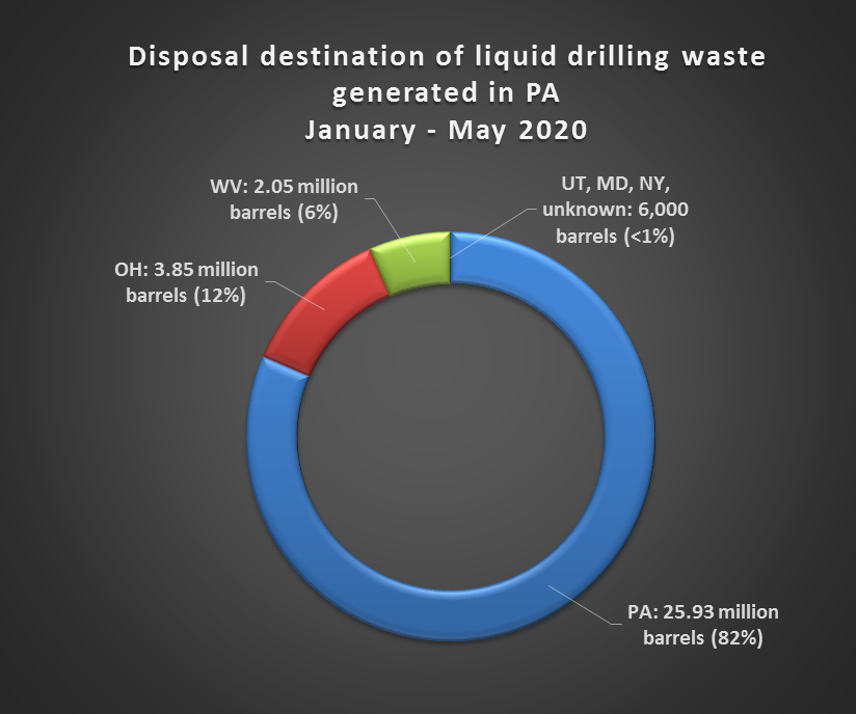
Figure 4. Pennsylvania’s liquid unconventional drilling waste disposal by state, January-May 2020


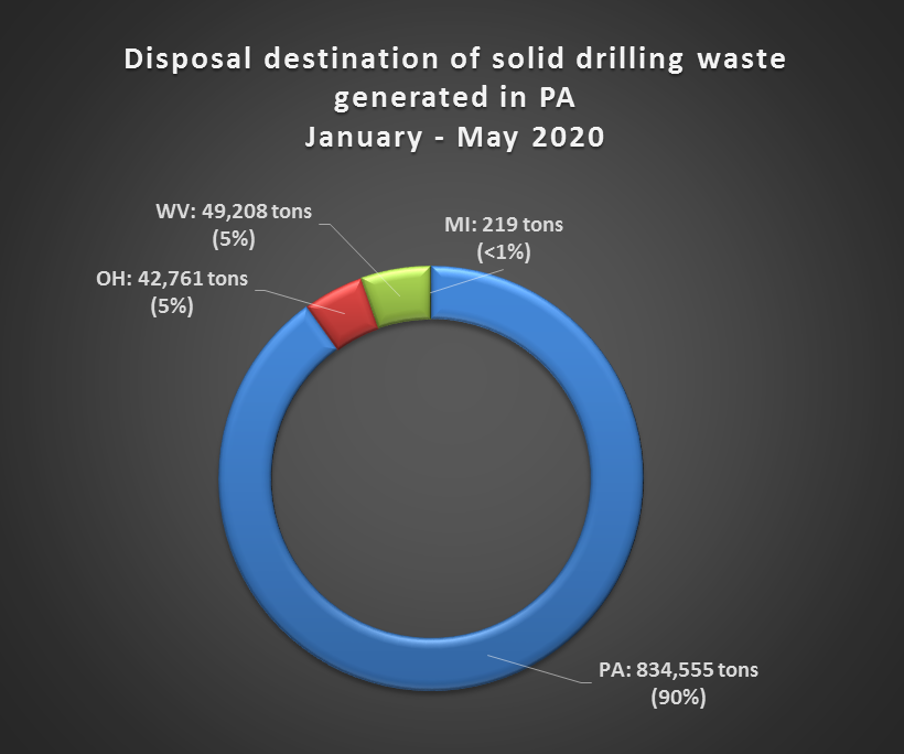
Figure 5. Pennsylvania’s solid unconventional drilling waste disposal by state, January-May 2020

In conclusion

FracTracker applauds New York State for closing the fracking waste loophole and in doing so, continuing to set high standards to protect its residents from the human and environmental impacts created by oil and gas extraction. We hope that other states will follow suit, and develop their own stringent standards to protect human and environmental health, in particular where federal legislation like RCRA has fallen woefully short.

By Karen Edelstein, Eastern Program Coordinator, FracTracker Alliance

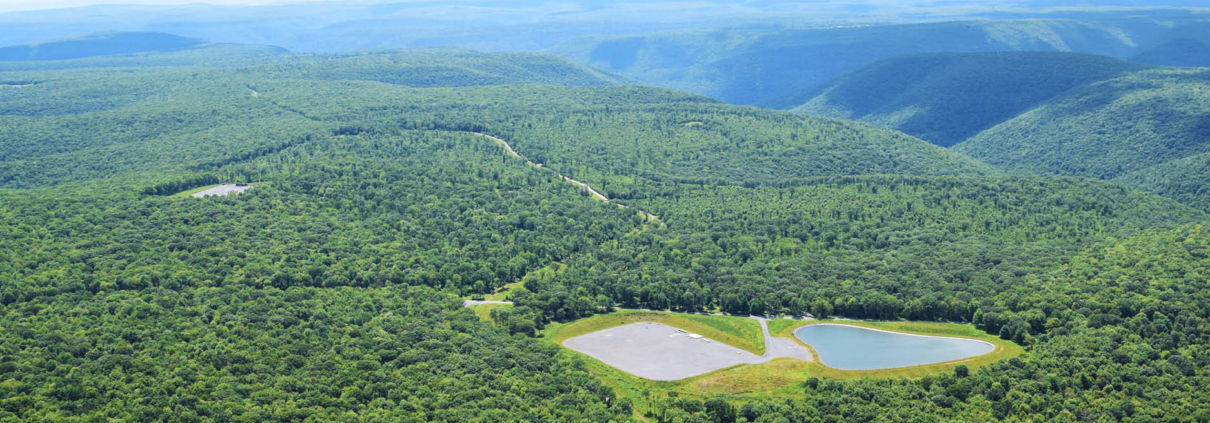
Feature photo by Ted Auch, FracTracker Alliance, with aerial support by Lighthawk

Support this work

`

DONATE

Stay in the know

The Loyalsock Watershed Project

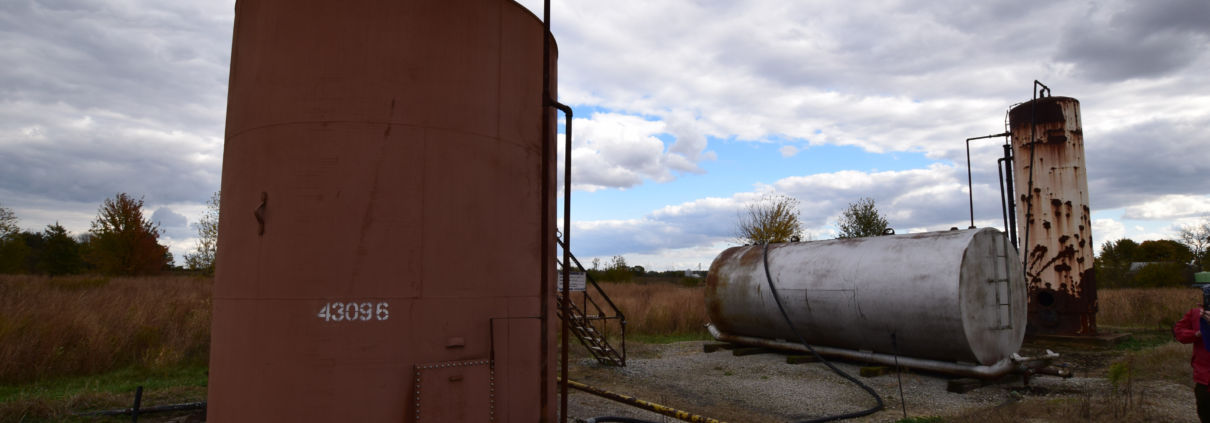
Oil & Gas waste tank operated by SWEPI and Enervest at the Hayes pad, Otsego County, Michigan May 21st, 2016

The North Dakota Shale Viewer Reimagined: Mapping the Water and Waste Impact

We updated the FracTracker North Dakota Shale Viewer with current data and additional details on the astronomical levels of water used and waste produced throughout the process of fracking for oil and gas in North Dakota.

As folks who visit the FracTracker website may know, the fracking industry is predicated on cheap sources of water and waste disposal. The water they use to bust open shale seams becomes part of the waste stream that they refer to by the benign term “brine,” equating it to nothing more than the salt water we swim in when we hit the beaches.

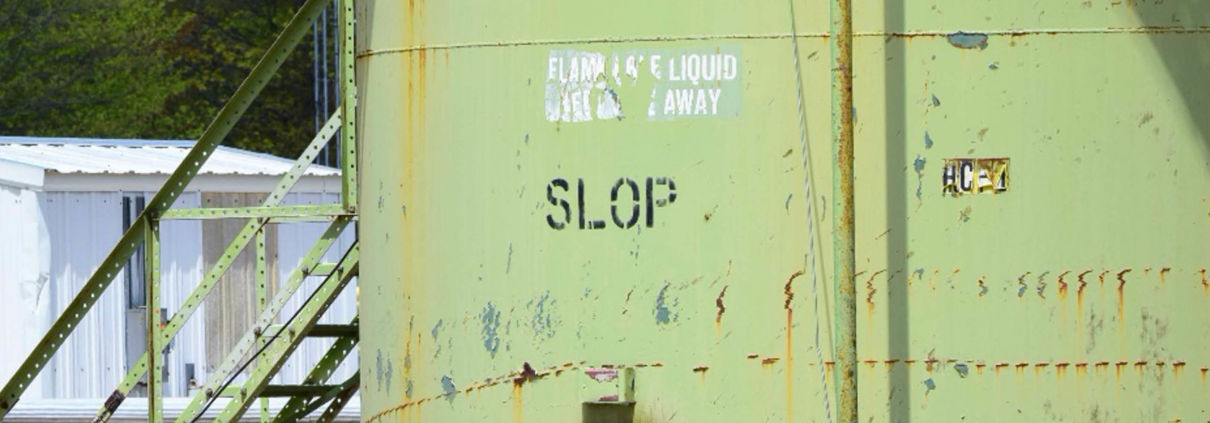
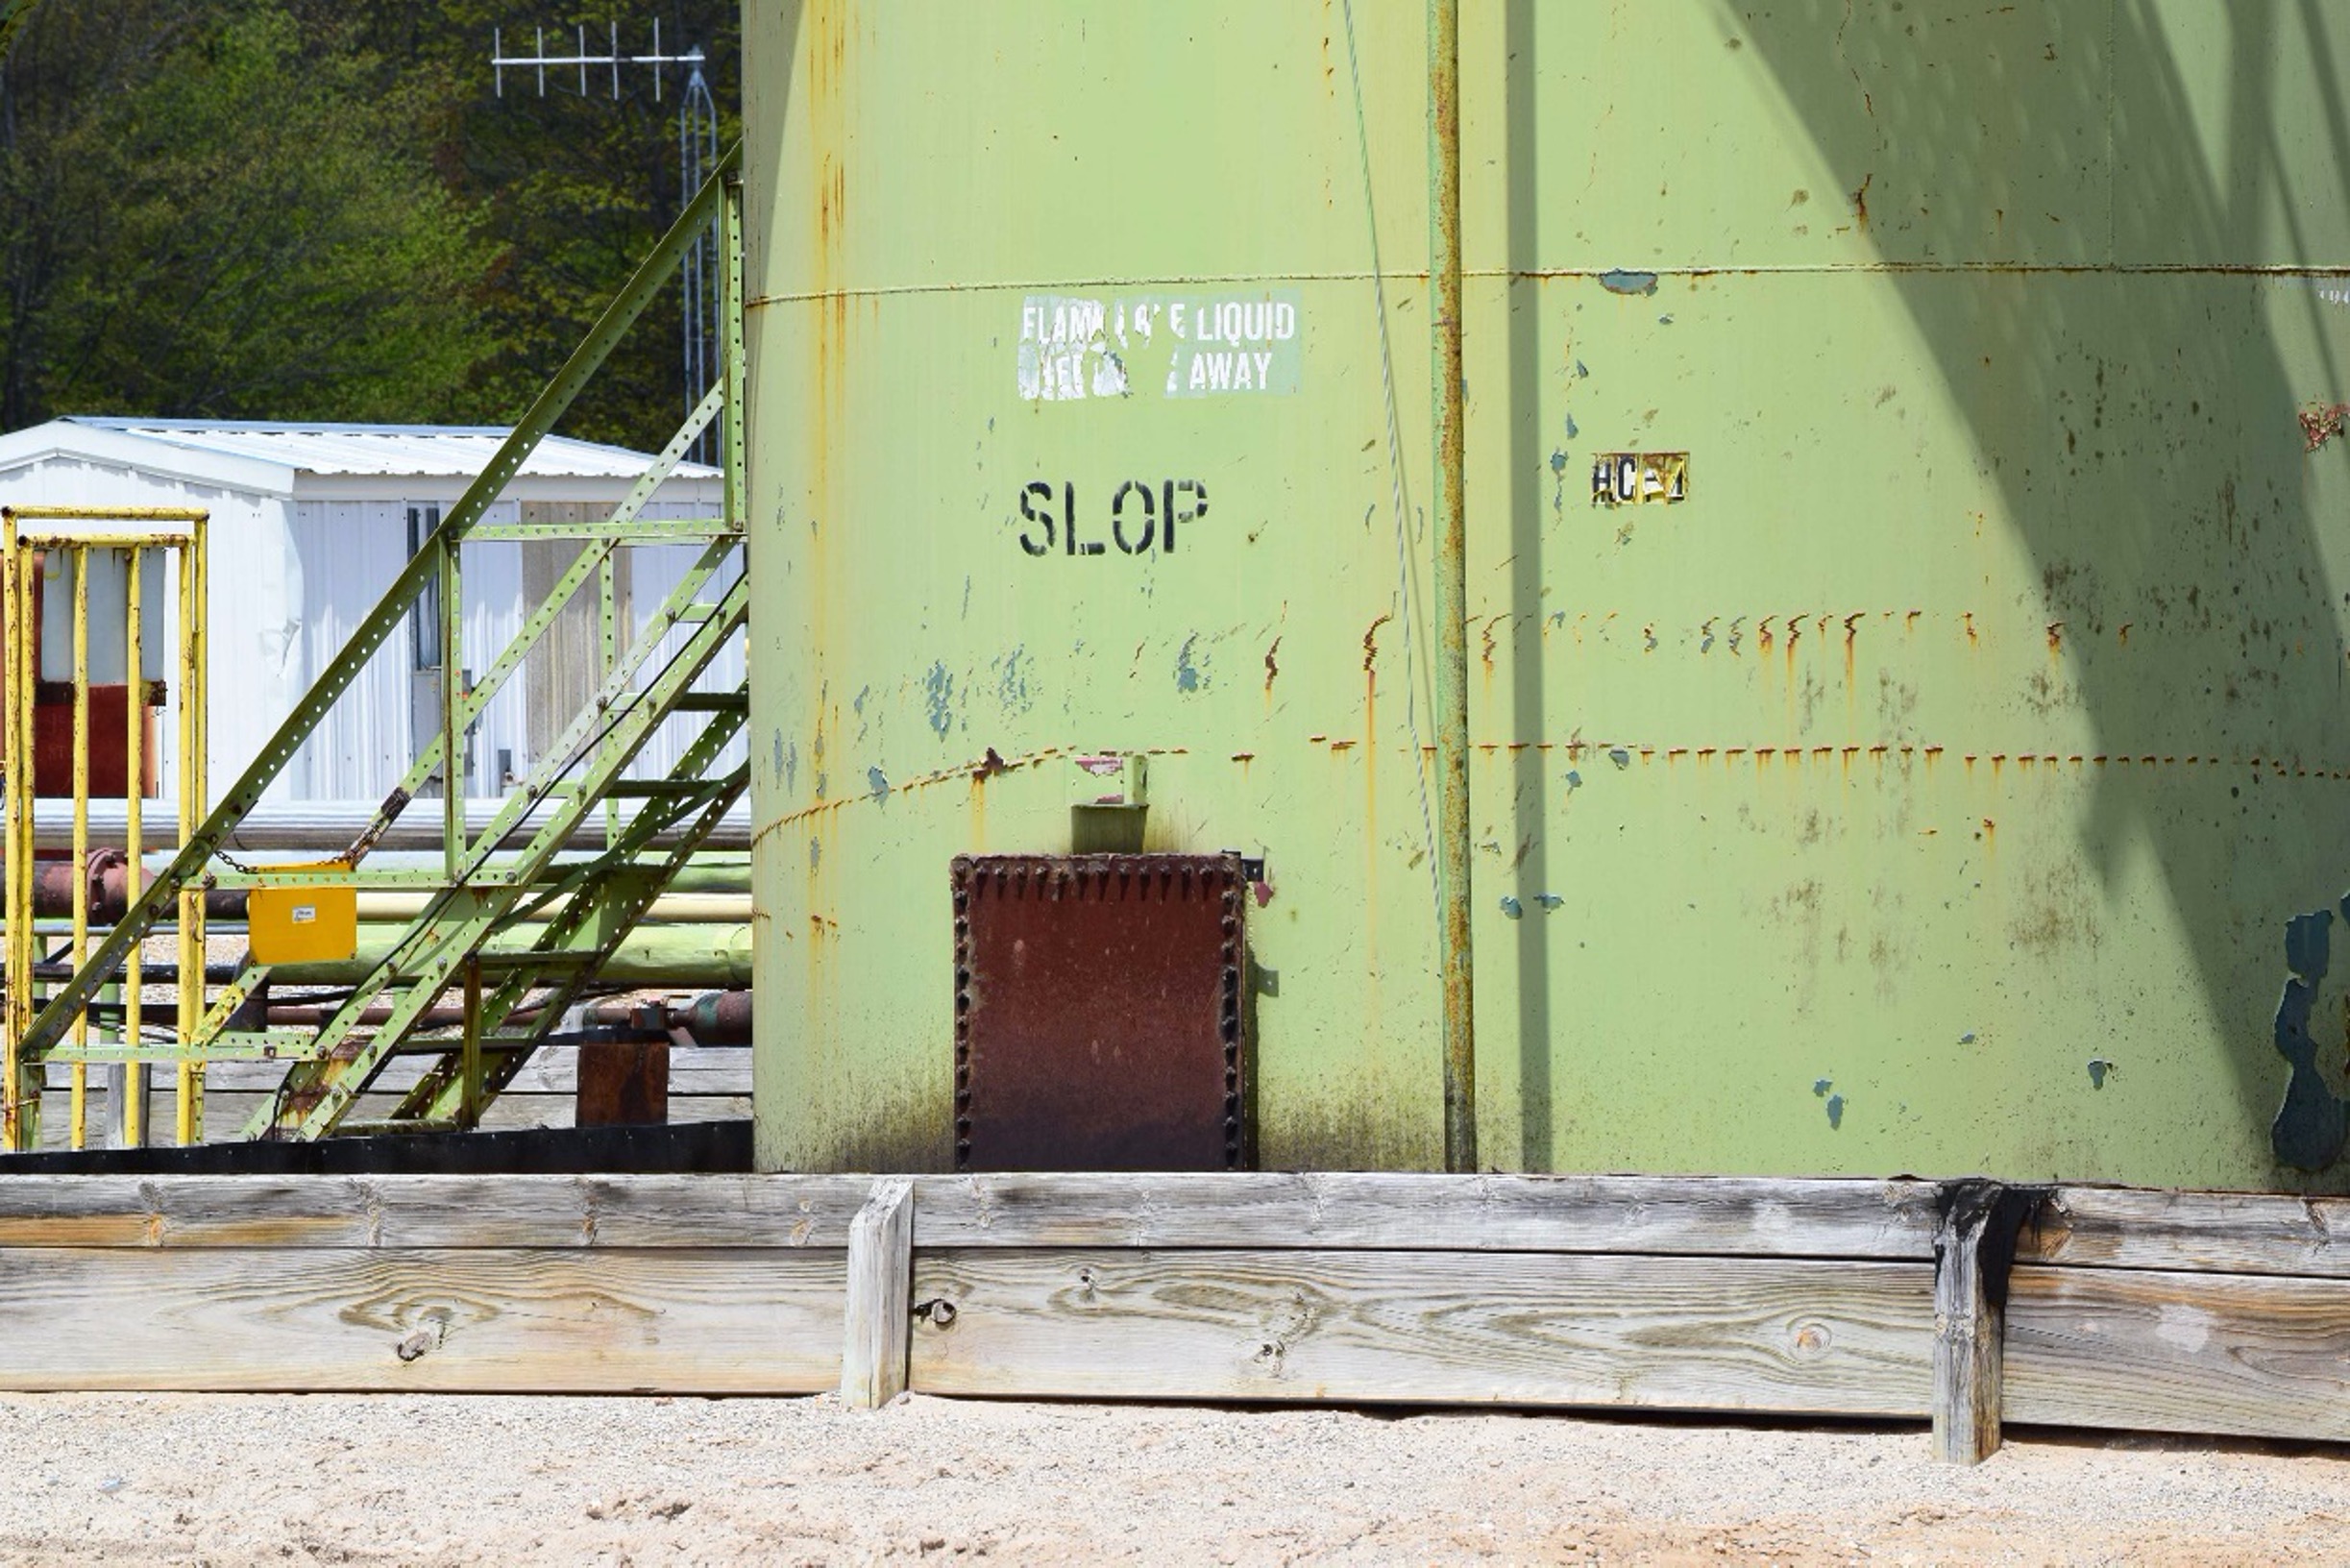
Some oil and gas operators like SWEPI and Enervest in Michigan, however, have taken to calling their waste “SLOP” (Figure 1), which from my standpoint is actually refreshingly honest.

Fracking Energy Return on Investment 2012 – 2020

Since we created our North Dakota Shale Viewer on October 5th, 2012, much has changed across the fracking landscape, while other songs have remained the same. Both of these truths exist with respect to fracking’s impact on water and the industry’s inability to get its collective head around the billions of barrels of oftentimes radioactive waste it produces by its very nature. From the outset, fracking was on dubious footing when it came to the water and waste associated with its operations, and we have seen a nearly universal and exponential increase in water demand and waste production on a per well basis since fracking became the highly divisive topic it remains to this day.

Oil & Gas waste tank operated by SWEPI and Enervest at the Hayes pad, Otsego County, Michigan May 21st, 2016 (44.892933, -84.786530).

Figure 1. Oil & Gas waste tank operated by SWEPI and Enervest at the Hayes pad, Otsego County, Michigan May 21st, 2016 (44.892933, -84.786530). Photo by Ted Auch, FracTracker Alliance.

Environmental economists like to look at energy sources from a more holistic standpoint vis a vis engineers, traditional economists, and the divide-and-conquer rhetoric from Bismarck to the White House. They do this by placing all manner of energy sources along a spectrum of Energy Return On Energy Invested (EROEI).

Since the dawn of the fracking revolution, shale gas from horizontal wells has been near the bottom of the league tables with respect to EROEI which means it “…has decreased from more than 1000:1 in 1919 to 5:1 in the 2010s, and for production from about 25:1 in the 1970s to approximately 10:1 in 2007” for US oil and gas according to Hall et al. (2014). This is what John Erik Meyer has come the “EROI Mountain” whereby we’ve already “burned through the richest resources.”

It stands to reason that if natural gas from fracking were a real “bridge fuel” in the transition away from coal, it would at least approach or exceed the EROEI of the latter, but at 46:1 coal is still four times more efficient than natural gas. However, it must be said that coal’s days are numbered as well. Witness the recent bankruptcy of coal giant Murray Energy, and the only reason its EROEI has increased or remained steady is because the mining industry has transitioned to almost exclusively mountaintop removal and/or strip mining and the associated efficiencies resulting from mechanization/automation.

The North Dakota Shale Viewer

We enhanced our North Dakota Shale Viewer nearly eight years since it debuted. This exercise included the addition of several data layers that speak to the above issues and how they have changed since we first launched the North Dakota Shale Viewer.

View map fullscreen 

It is worth noting that oil production in total across North Dakota has not even doubled since 2012, and gas production has only managed to increase 3.5-fold. However, the numbers look even worse when you look at these totals on a per well basis, which as I have mentioned seems to me to be the only way reasonable people should be looking at production. Using this lens, we see that production of oil in North Dakota on a per well basis oil is 1% less than it was in 2012 and gas production has not even doubled per well. This is a stunning contrast to the upticks in water and waste we have documented and are now including in our North Dakota Shale Viewer.

Water Demand Rises for Fracking

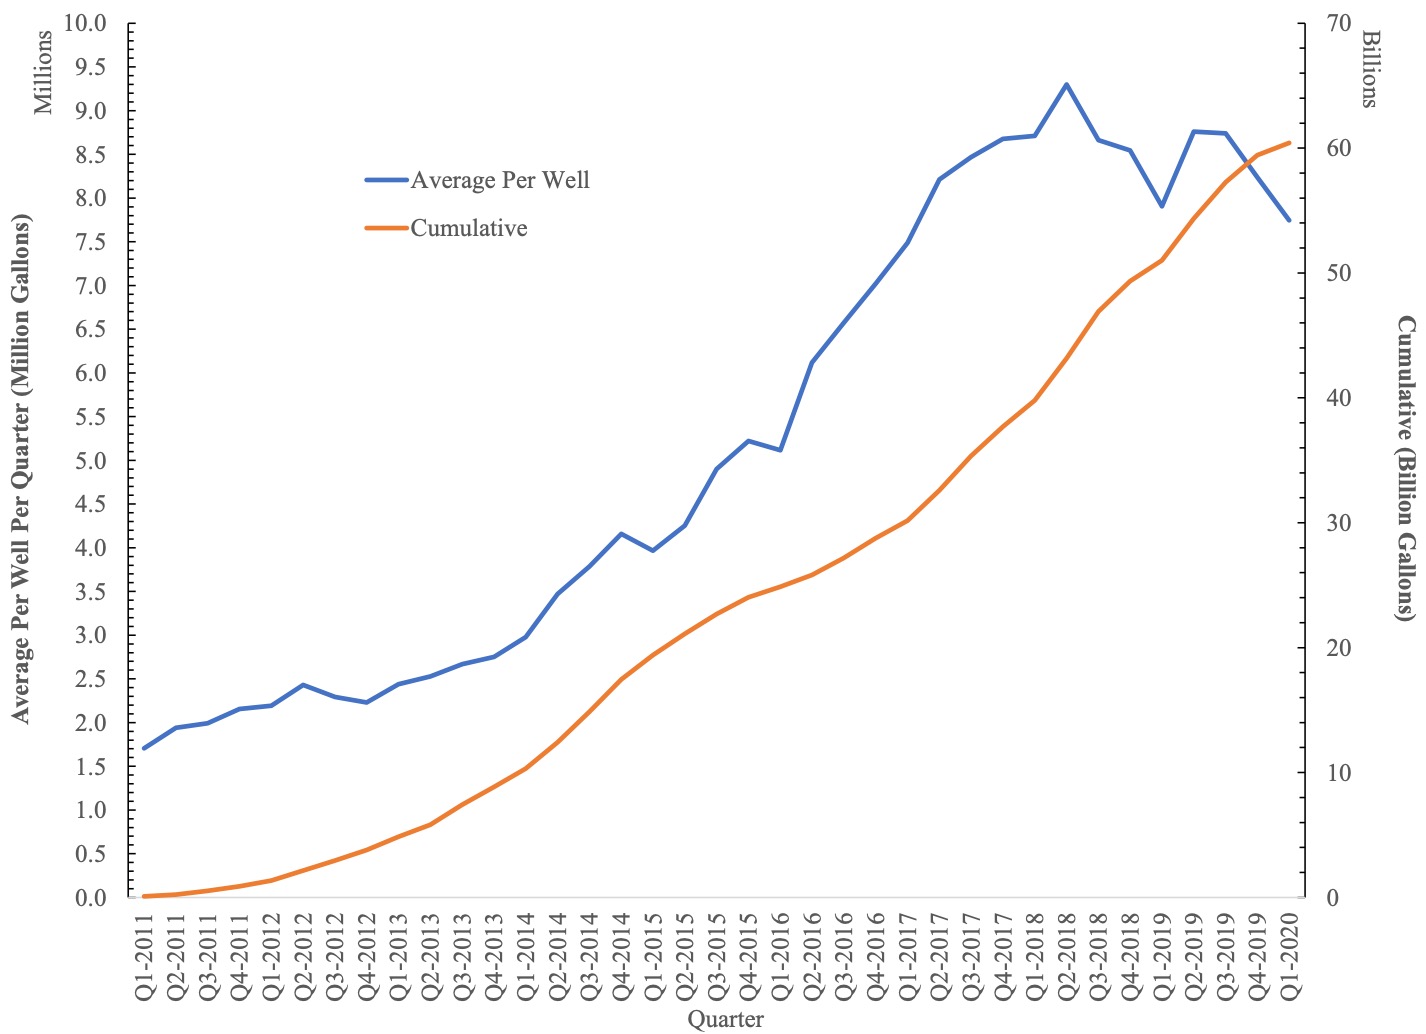
We’ve incorporated individual horizontal well freshwater demand for nearly 12,000 wells up to and including Q1-2020. The numbers are jaw dropping when you consider that at the time we debuted this map North Dakota, unconventional wells were using roughly 2.1 million gallons per well compared to an average of 8.3 million gallons per well so far this year. This per well increase is something we have been documenting for years now in states like Pennsylvania, Ohio, and West Virginia.

This is concerning for multiple reasons, the first being that if fracking ever were to rebound to its halcyon days of the early teens, it would mean some of our country’s most prized and fragile watersheds would be pushed to an irreversible hydrological tipping point. Hoekstra et al. (2012) have come to call this the “blue water” precautionary principle whereby “depletion beyond 20% of a river’s natural flow increases risks to ecological health and ecosystem services.”

Another concern is that while permitting in North Dakota has slowed like it has nationwide, the aforementioned quarterly water usage totals per well are now 5.25 times what they were in October 2012 and the total water used by the industry in North Dakota now amounts to 60.43 billion gallons– that we know of —  which is nearly 50 times what the industry had used when we created our North Dakota Shale Viewer (Figure 2).[1]

With respect to the points made earlier about the value of EROEI, this increase in water demand has not been reflected in the productivity of North Dakota’s oil and gas wells, which means the EROEI continues to fall at rate that should make the industry blush.  Furthermore, this trend should prompt regulators and elected officials in Bismarck and elsewhere to begin to ask if the long-term and permanent environmental and/or hydrological risk is worth the short-term rewards vis à vis the “blue water” precautionary principle, in this case of the Missouri River, outlined by Hoekstra et al. (2012). It is my opinion that it most assuredly is not and never was worth the risk!

The most stunning aspect of the above divergence in production and water demand is that on a per well basis, water only costs the industry roughly 0.46-0.76% of total well pad costs. This narrow range is a function of the water pricing schemes shared with me by the North Dakota Western Area Water Supply Authority (WAWSA). This speaks to an average price of water between $3.68 and $4.07 per 1,000 gallons for “industrial” use (aka, fracking industry) by way of eight depots and “several hundred miles of transmission and distribution lines” spread across the state’s four northwest counties of Mountrail, Divide, Williams, and McKenzie.


Figure 2. Average Freshwater Demand Per Well and Cumulative Freshwater Demand by North Dakota fracking industry from 2011 to Q1-2020.

Average Freshwater Demand Per Well and Cumulative Freshwater Demand by North Dakota fracking industry from 2011 to Q1-2020

Increasing Fracking Waste Production

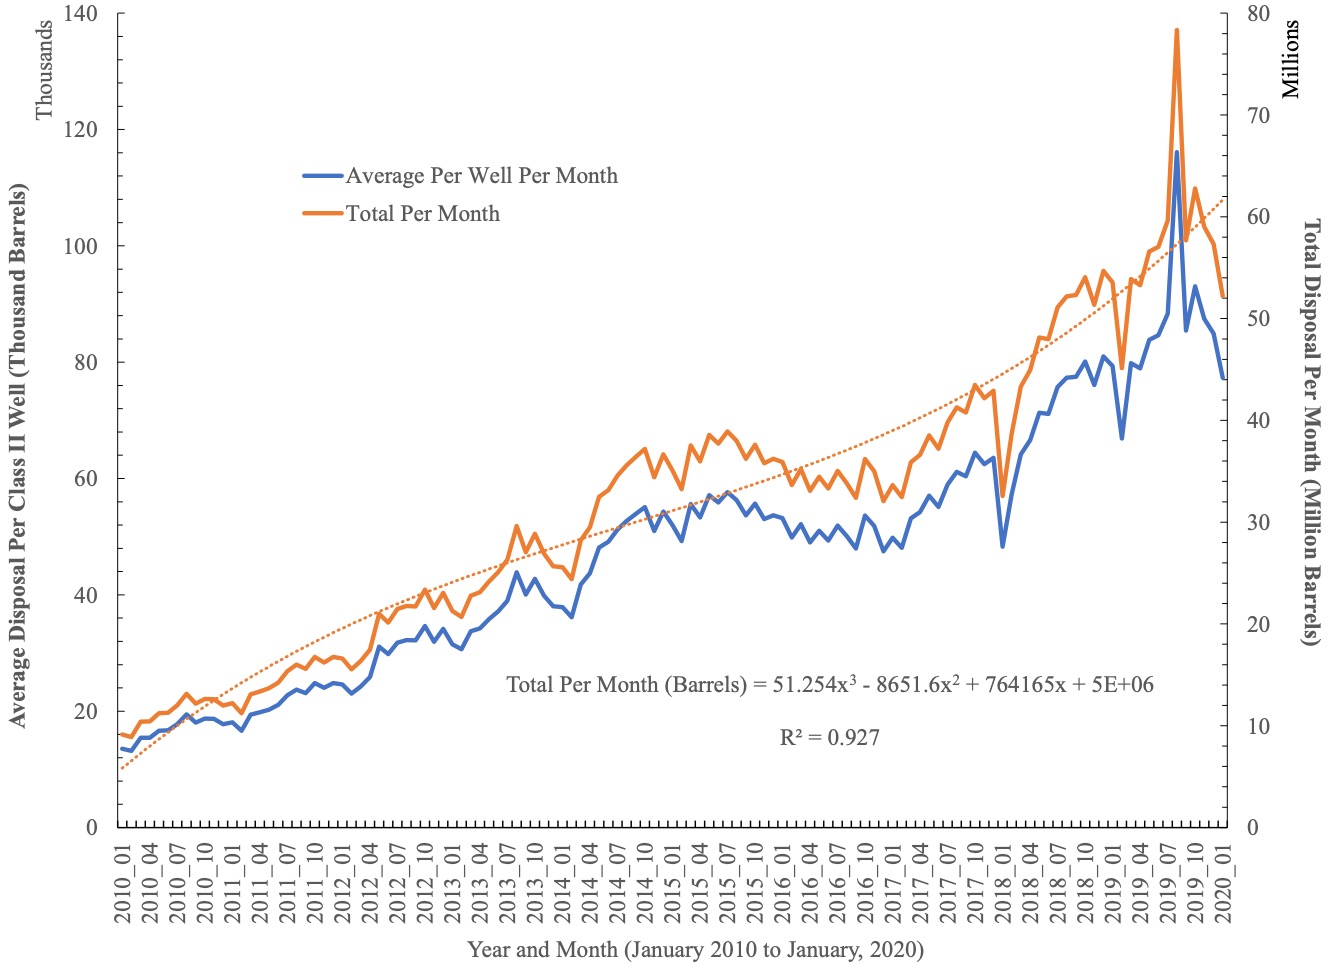
On the fracking waste front, the monthly trend is quite volatile relative to what we’ve documented in states like Oklahoma, Kansas, and Ohio. Nonetheless, the amount of waste produced is increasing per well and in total. How you quantify this increase is quite sensitive to the models you fit to the data. The exponential and polynomial (Plotted in Figure 3) fits yield 4.76 to 9.81 million barrel per month increases, while linear and power functions yield the opposite resulting in 1.82 to 10.91 million-barrel declines per month. If we assume the real answer is somewhere in between we see that fracking waste is increasingly slightly at a rate of 1.51% per year or 460,194 barrels per month.


Figure 3. Average Per Well and Monthly Total Fracking Waste Disposal across 675 North Dakota Class II Salt Water Disposal (SWD) wells from 2010 to Q1-2020.

Average Per Well and Monthly Total Fracking Waste Disposal across 675 North Dakota Class II Salt Water Disposal (SWD) wells from 2010 to Q1-2020.


North Dakota has concerning legislation related to oil and gas waste disposal. Senate Bill 2344 claims that landowners do not actually own the “subsurface pore space” beneath their property. The bill was passed into law by Legislature last Spring but there are numerous lawsuits working against it. We will have further analysis of this bill published on FracTracker.org soon.


Earthworks ND Frack Waste Report

FracTracker collaborated with Earthworks to create an interactive map that allows North Dakota residents to determine if oil and gas waste is disposed of or has spilled near them in addition to a list of recommendations for state and local policymakers, including the closing of the state’s harmful oil and gas hazardous waste loophole. Read the report for detailed information about oil and gas waste in North Dakota.


The Value of Our Water

This data is critical to understanding the environmental and/or hydrological impact(s) of fracking, whether it is Central Appalachia’s Ohio River Valley, or in this case North Dakota’s Missouri River Basin. We will continue to periodically update this data.

Without supply-side price signaling or adequate regulation, it appears that the industry is uninterested and insufficiently incentivized to develop efficiencies in water use. It is my opinion that the only way the industry will be incentivized to do so is if states put a more prohibitive and environmentally responsible price on water and waste. In the absence of outright bans on fracking, we must demand the industry is held accountable for pushing watersheds to the brink of their capacity, and in the process, compromising the water needs of so many communities, flora, and fauna.

Data Links

  1. Water Usage for nearly 12,000 fracked laterals in North Dakota up to and including April, 2020. We also include API number and operator in GIS, KML, and Spreadsheet formats. (https://fractracker.org/wp-content/uploads/2020/05/ND_FracFocus_April_2020_With_KML_Excel.zip)
  2. Monthly volumes (2010 to 2020) and demographics for surrounding area for the 675 Class II Salt Water Disposal (SWD) Fracking Waste Injection Wells in North Dakota. We also include API number and operator in GIS, KML, and Spreadsheet formats. (https://fractracker.org/wp-content/uploads/2020/05/ND_ClassII_Well_MonthlyWaste_2010_Q2_2020_Demographics_WithKML_Excel.zip)
  3. North Dakota Gas Plants (https://fractracker.org/wp-content/uploads/2020/06/GasPlants_WithExcel_KML.zip)

[1] Here in Ohio where I have been looking most closely at water supply and demand across the fracking landscape it is clear that we aren’t accounting for some 10-12% of water demand when we compare documented water withdrawals in the numerator with water usage in the denominator.

By Ted Auch, PhD, Great Lakes Program Coordinator

Support this work

`

DONATE

Stay in the know

Overhead view of injection well

The Hidden Inefficiencies and Environmental Costs of Fracking in Ohio

Ohio continues to increase fracked gas production, facilitated by access to freshwater and lax radioactive waste disposal requirements.

View map fullscreen | How FracTracker maps work

Map: Ohio Quarterly Utica Oil and Gas Production along with Quarterly Wastewater Disposal

Well Volumes

A little under a year ago, FracTracker released a map and associated analysis, “A Disturbing Tale of Diminishing Returns in Ohio,” with respect to Utica oil and gas production, highlighting the increasing volume of waste injected in wastewater disposal wells, and trends in lateral length in fracked wells from 2010 to 2018. In this article, I’ll provide an update on Ohio’s Utica oil and gas production in 2018 and 2019, the demands on freshwater, and waste disposal. After looking at the data, I recommend that we holistically price our water resources and the ways in which we dispose of the industry’s radioactive waste in order to minimize negative externalities.

Recently, I’ve been inspired by the works of Colin Woodward[1] and Marvin Harris, who outline the struggle between liberty and the common good. They relate this to the role that commodities and increasing resource intensity play in maintaining or enhancing living standards. This quote from Harris’s “Cannibals and Kings” struck me as the 122 words that most effectively illustrate the impacts of the fracking boom that started more than a decade ago in Central Appalachia:

“Regardless of its immediate cause, intensification is always counterproductive. In the absence of technological change, it leads inevitably to the depletion of the environment and the lowering of the efficiency of production since the increased effort sooner or later must be applied to more remote, less reliable, and less bountiful animals, plants, soils, minerals, and sources of energy. Declining efficiency in turn leads to low living standards – precisely the opposite of the desired result. But this process does not simply end with everybody getting less food, shelter, and other necessities in return for more work. As living standards decline, successful cultures invent new and more efficient means of production which sooner or later again lead to the depletion of the natural environment.” From Chapter 1, page 5 of Marvin Harris’ “Cannibals and Kings: The Origins of Cultures, 1977

In reflecting on Harris’s quote as it pertains to fracking, I thought it was high time I updated several of our most critical data sets. The maps and data I present here speak to intensification and the fact that the industry is increasingly leaning on cheap water withdrawals, landscape impacts, and waste disposal methods to avoid addressing their increasingly gluttonous ways. To this point, the relationship between intensification and resource utilization is not just the purview of activists, academics, and journalists anymore; industry collaborators like IHS Markit admitting as much in their latest analysis pointing to the fact that oil and gas operators “will have to drill substantially more wells just to maintain current production levels and even more to grow production”. Insert Red Queen Hypothesis analogy here!

Oil and Gas Production in Ohio

The four updated data sets presented here are: 1) oil, gas, and wastewater production, 2) surface and groundwater withdrawal rates for the fracking industry, 3) freshwater usage by individual Ohio fracked wells, and 3) wastewater disposal well (also referred to as Class II injection wells) rates.

Below are the most important developments from these data updates as it pertains to intensification and what we can expect to see in the future, with or without the ethane cracker plants being trumpeted throughout Appalachia.

From a production standpoint, total oil production has increased by 30%, while natural gas production has increased by 50% year over year between the last time we updated this data and Q2-2019 (Table 1).

According to the data we’ve compiled, the rate of growth for wastewater production has exceeded oil and is nearly equal to natural gas at 48% from 2017 to 2018.  On average the 2,398 fracked wells we have compiled data for are producing 27% more wastewater per well now than they did at the end of 2017.

————–2017————– ————–2019————–
Oil (million barrels) Gas (million Mcf) Brine (million barrels) Oil (million barrels) Gas (million Mcf) Brine (million barrels)
Max 0.51 12.92 0.23 0.62 17.57 0.32
Total 83.14 5,768.47 76.01 108.15 8,679.12 112.28
Mean 0.40 2.79 0.37 0.45 3.62 0.47

Table 1. Summary statistics for 2,398  fracked wells in Ohio from a production perspective from 2017 to Q2 2019.


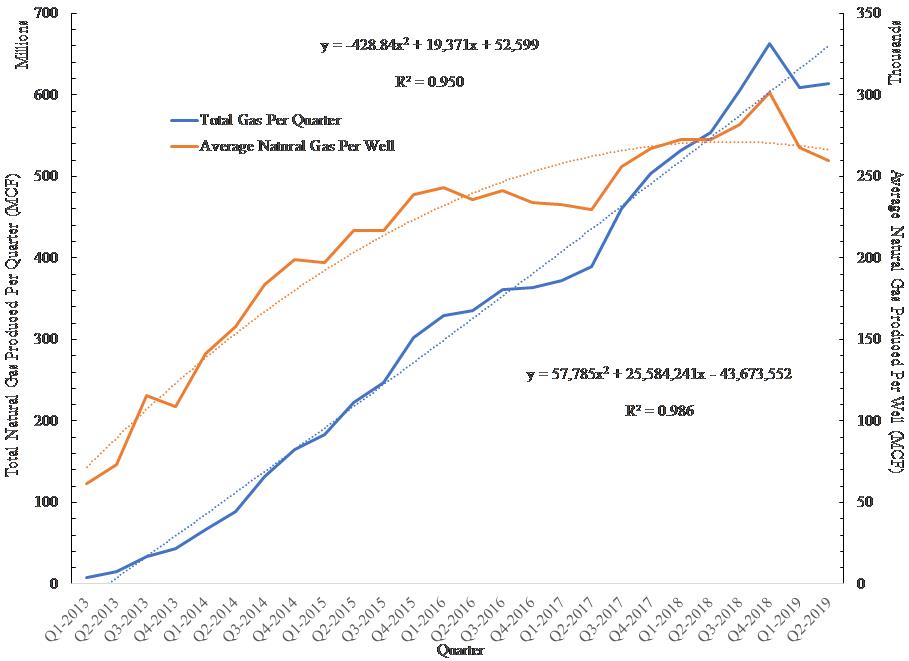
Total fracked gas produced per quarter and average fracked gas produced per well in Ohio from 2013 to Q2-2019.

Figure 1. Total fracked gas produced per quarter and average fracked gas produced per well in Ohio from 2013 to Q2-2019.

The increasing amount of resources and number of wells necessary to achieve marginal increases in oil and gas production is a critical factor to considered when assessing industry viability and other long-term implications. As an example, in Ohio’s Utica Shale, we see that total production is increasing, but as IHS Markit admits, this is only possibly by increasing the total number of producing wells at a faster rate. As is evidenced in Figure 1, somewhere around the Winter of 2017-2018, the production rate per well began to flatline and since then it has begun to decrease.

Water demands for oil and gas production in Ohio

Since last we updated the industry’s water withdrawal rates, the Ohio Department of Natural Resources (ODNR) has begun to report groundwater rates in addition to surface water. The former now account for nine sites in seven counties, but amount to a fraction of reported withdrawals to date (around 00.01% per year in 2017 and 2018). The more disturbing developments with respect to intensification are:

1) Since we last updated this data, 59 new withdrawal sites have come online. There are currently 569 sites in total in ODNR’s database. This amounts to a nearly 12% increase in the total number of sites since 2017. With this additional inventory, the average withdrawal rate across all sites has increased by 13% (Table 2).

2) Since 2010, the demand for freshwater to be used in fracking has increased by 15.6% or 693 million gallons per year (Figure 2).

3) We expect to see an inflection point when water production will increase to accommodate the petrochemical buildout with cracker plants in Dilles Bottom, OH; Beaver County, PA; and elsewhere. In 2018 alone, the oil and gas industry pulled 4.69 billion gallons of water from the Ohio River Valley. Since 2010, the industry has permanently removed 22.96 billion gallons of freshwater from the Ohio River Valley. It would take the entire population of Ohio five years to use the 2018 rate in their homes.[2]

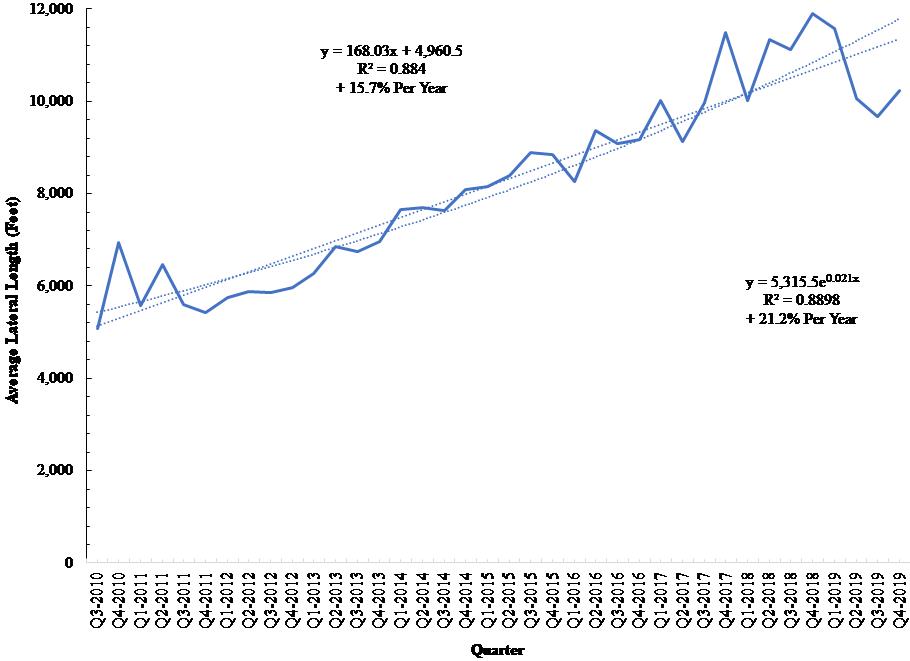
As we and others have mentioned in the past, this trend is largely due to the bargain basement price at which we sell water to the oil and gas sector throughout Appalachia.[3] To increase their nominal production returns, companies construct longer laterals with orders of magnitude more water, sand, and chemicals.  At this rate, the fracking industry’s freshwater demand will have doubled to around 8.8-.9.5 billion gallons per year by around 2023.  Figure 3 demonstrates that average fracked lateral length continues to increase to the tune of +15.7-21.2% (+1,564-2,107 feet) per quarter per lateral. This trend alone is more than 2.5 times the rate of growth in oil production and roughly 24% greater than the rate of growth in natural gas production (See Table 1).

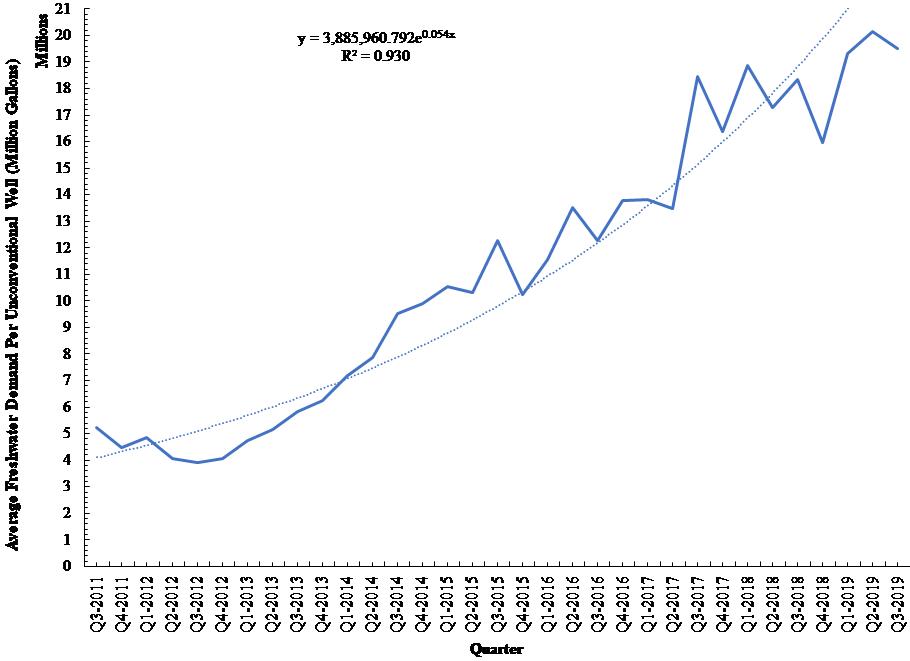
4. The verdict is even more concerning than it was a couple years ago with respect to water demand increasing by 30% per quarter per well or an average of 4.73 million gallons (Figure 4). The last time we did this analysis >1.5 years ago demand was rising by 25% per quarter or 3.84 million gallons. At that point I wouldn’t have guessed that this exponential rate of water demand would have increased but that is exactly what has happened. Very immediate conversations must start taking place in Columbus and at the region’s primary distributor of freshwater, The Muskingum Watershed Conservancy District (MWCD), as to why this is happening and how to push back against the unsustainable trend.

2017 2018
Sites 510 569
Maximum (billion gallons) 1.059 1.661
Sum (billion gallons) 18.267 22.957
Mean (billion gallons) 0.358 0.404

Table 2. Summary of fracking water demands throughout Ohio in 2017 when we last updated this data as well as how those rates changed in 2018.

Hydraulic fracturing freshwater demand in total across 560+ sites in Ohio from 2010 to 2018 (Million Gallons Per Year).

Figure 2. Hydraulic fracturing freshwater demand in total across 560+ sites in Ohio from 2010 to 2018 (million gallons per year).

Average lateral length for all of Ohio’s permitted hydraulically fractured laterals from from Q3-2010 to Q4-2019, along with average rates of growth from a linear and exponential standpoint (Feet).

Figure 3. Average lateral length for all of Ohio’s permitted hydraulically fractured laterals from from Q3-2010 to Q4-2019, along with average rates of growth from a linear and exponential standpoint (feet).

Average Freshwater Demand Per Unconventional Well in Ohio from Q3-2011 to Q3-2019 (Million Gallons).

Figure 4. Average Freshwater Demand Per Unconventional Well in Ohio from Q3-2011 to Q3-2019 (million gallons).


Waste Disposal

When it comes to fracking wastewater disposal, the picture is equally disturbing. Average disposal rates across Ohio’s 220+ wastewater disposal wells increased by 12.1% between Q3-2018 and Q3-2019 (Table 3). Interestingly, this change nearly identically mirrors the change in water withdrawals during the same period. What goes down– freshwater – eventually comes back up.

Across all of Ohio’s wastewater disposal wells, total volumes increased by nearly 22% between 2018 and the second half of 2019. However, the more disturbing trend is the increasing focus on the top 20 most active wastewater disposal wells, which saw  an annual increase of 17-18%. These wells account for nearly 50% of all waste and the concern here is that many of the pending wastewater disposal well permits are located on these sites, within close proximity, and/or are proposed by the same operators that operate the top 20.

When we plot cumulative and average disposal rates per well, we see a continued exponential increase. If we look back at the last time, we conducted this analysis, the only positive we see in the data is that at that time, average rates of disposal per well were set to double by the Fall of 2020. However, that trend has tapered off slightly — rates are now set to double by 2022.

Each wastewater disposal well is seeing demand for its services increase by 2.42 to 2.94 million gallons of wastewater per quarter (Figure 5). Put another way, Ohio’s wastewater disposal wells are rapidly approaching their capacity, if they haven’t already.  Hence why the oil and gas industry has been frantically submitting proposals for additional waste disposal wells. If these wells materialize, it means that Ohio will continue to be relied on as the primary waste receptacle for the fracking industry throughout Appalachia.

Variable ——————-All Wells——————- ——————-Top 20——————-
To Q3-2018 To Q3-2019 % Change To Q3-2018 To Q3-2019 % Change
Number of Wells 223 243 +9.0 ——- ——- ——-
Max (MMbbl) 1.12 1.20 +7.1 ——- ——- ——-
Sum (MMbbl) 203.19 247.05 +21.6 101.43 119.31 +17.6
Average (MMbbl) 0.91 1.02 +12.1 5.07 5.97 +17.8

Table 3. Summary Statistics for Ohio’s Wastewater Disposal Wells (millions of barrels (MMbbl)).

Average Fracking Waste Disposal across all of Ohio’s Class II Injection Wells and the cumulative amount of fracking waste disposed of in these wells from Q3-2010 to Q2-2019 (Million Barrels).

Figure 5. Average Fracking Waste Disposal across all of Ohio’s Wastewater Disposal Wells and the cumulative amount of fracking waste disposed of in these wells from Q3-2010 to Q2-2019 (million barrels).

Using the Pennsylvania natural gas data merged with the Ohio wastewater data, we were able to put a finer point on how much wastewater would be produced with a 100,000 barrel ethane cracker like the one PTT Global Chemical has proposed for Dilles Bottom, Ohio. The following are our best estimate calculations assuming 1 barrel of condensate is 20-40% ethane. These calculations required that we take some liberties with the merge of the ratio of gas to wastewater in Ohio with the ratio of gas to condensate in Pennsylvania:

  1. For 2,064 producing Ohio fracked wells, the ratio of gas to wastewater is 64.76 thousand cubic feet (Mcf) of gas produced per barrel of wastewater.
  2. Assuming 40% ethane, the ratio of gas to condensate in Washington County, PA wells for the first half of 2019 was 320.08 Mcf of gas per barrel of ethane condensate. For 100,000 barrels of ethane needed per cracker per day, that would result in 494,285 barrels (20.76 million gallons) of brine per day.
  3. Assuming 20% ethane, the ratio of gas to condensate in Washington County, PA wells for the first half of 2019 was 640.15 Mcf per barrel of ethane condensate = For 100,000 barrels of ethane needed per cracker per day that would result in 988,571 barrels/41.52 million gallons of wastewater per day.

But wait, here is the real stunner:

  1. The 40% assumption result is 3.81 times the daily rates of wastewater taken in by our current inventory of wastewater disposal wells and 5.37 times the daily rates of brine taken in by the top 20 wells (Note: the top 20 wastewater disposal wells account for 71% of all wastewater  waste taken in by all of the state’s disposal wells).
  2. The 20% assumption result is 7.62 times the daily rates of wastewater taken in by our current inventory of wastewater disposal wells and 10.74 times the daily rates of wastewater taken in by the top 20 wells.

Therefore, we estimate the fracked wells supplying the proposed PTTGC ethane cracker will generate between 20.76 million and 41.52 million gallons of wastewater per day. That is 3.8 to 7.6 times the amount of wastewater currently received by Ohio’s wastewater disposal wells.

What does this means in terms of truck traffic? We can assume that  at least 80% of the trucks that transport wastewater are the short/baby bottle trucks which haul 110 barrels per trip. This means that our wastewater estimates would require between 4,493 and 8,987 truck trips per day, respectively. The pressures this amount of traffic will put on Appalachian roads and communities will be hard to measure and given the current state of state and federal politics and/or oversight it will be even harder to measure the impact inevitable spills and accidents will have on the region’s waterways.

Conclusion

There is no reason to believe these trends will not persist and become more intractable as the industry increasingly leans on cheap waste disposal and water as a crutch. The fracking industry will continue to present shareholders with the illusion of a robust business model, even in the face of rapid resource depletion and precipitous production declines on a per well basis.

I am going to go out on a limb and guess that unless we more holistically price our water resources and the ways in which we dispose of the industry’s radioactive waste, there will be no other supply-side signal that we could send that would cause the oil and gas industry to change its ways. Until we reach that point, we will continue to compile data sets like the ones described above and included in the map below, because as Supreme Court Justice Louis Brandeis once said, “Sunlight is the best disinfectant!”

By Ted Auch, Great Lakes Program Coordinator, FracTracker Alliance with invaluable data compilation assistance from Gary Allison

[1] Colin Woodward’s “American Character: A history of the epic struggle between individual liberty and the common good” is a must read on the topic of resource utilization and expropriation.

[2] https://pubs.er.usgs.gov/publication/cir1441

[3] In Ohio the major purveyor of water for the fracking industry is the Muskingum Watershed Conservancy District (MCWD) and as we’ve pointed out in the past they sell water for roughly $4.50 to $6.50 per thousand gallons. Meanwhile across The Ohio River the average price of water for fracking industry in West Virginia in the nine primary counties where fracking occurs is roughly $8.38 per thousand gallons.

Data Downloads

Quarterly oil, gas, brine, and days in production for 2,390+ Unconventional Utica/Point Pleasant Wells in Ohio from 2010 to Q2-2019

https://fractracker.org/wp-content/uploads/2019/12/Production_To_Q2_2019_WithExcel.zip

Ohio Hydraulic Fracturing Freshwater and Groundwater Withdrawals from 2010 to 2018

https://fractracker.org/wp-content/uploads/2019/12/OH_WaterWithdrawals_2010_2018_WithExcel.zip

Lateral length (Feet) for 3,200+ Fracked Utica/Point Pleasant Wells in Ohio up to and including wells permitted in December, 2019

https://fractracker.org/wp-content/uploads/2020/01/OH_Utica_December_2019_StatePlane_Laterals.zip

Freshwater Use for 2,700+ Unconventional Wells in Ohio from Q3-2011 to Q3-2019

https://fractracker.org/wp-content/uploads/2019/12/OH_FracFocus_December_2019_WithExcel.zip

Quarterly Volume Disposal (Barrels) for 220+ Ohio Class II Salt Water Disposal Wells from 2010 to Q4-2019

https://fractracker.org/wp-content/uploads/2019/12/OH_ClassII_Loc_Vols_10_Q4_2019_WithExcel.zi

Support this work

`

DONATE

Stay in the know

Fracking in Pennsylvania: Not Worth It

Despite the ever-increasing heaps of violations and drilling waste, Pennsylvania’s fracked wells continue to produce an excess supply of gas, driving prices down. To cut their losses, the oil and gas industry is turning towards increased exports and petrochemical production. Continuing to expand fracking in Pennsylvania will only increase risks to the public and to the climate, all for what may amount to another boom and bust cycle that is largely unprofitable to investors.

Let’s take a look at gas production, waste, newly drilled wells, and violations in Pennsylvania in the past year to understand just how precarious the fracking industry is.

Production

Fracked hydrocarbon production continues to rise in Pennsylvania, resulting in an increase in waste production, violations, greenhouse gas emissions, and public health concerns. There are three types of hydrocarbons produced from wells in Pennsylvania: gas, condensate, and oil. Gas is composed mostly of methane, the most basic of the hydrocarbons, but in some parts of Pennsylvania, there can be significant quantities of ethane, propane, and other so-called “natural gas liquids” (NGLs) mixed in. Each of these NGLs are actually gaseous at atmospheric conditions, but operators try to separate these with a combination of pressure and low temperatures, converting them to a liquid phase. Some of these NGLs can be separated on-site, and this is typically referred to as condensate. Fracked wells in Pennsylvania also produce a relatively tiny amount of oil.

View map fullscreen | How FracTracker maps work

For those of you wondering why we are looking at the November, 2018 through October, 2019 time frame, this is simply a reflection of the available data. In this 12-month period, 9,858 fracked Pennsylvania wells, classified as “unconventional,” reported producing 6.68 trillion cubic feet of gas (Tcf), 4.89 million barrels of condensate, and just over 70,000 barrels of oil.

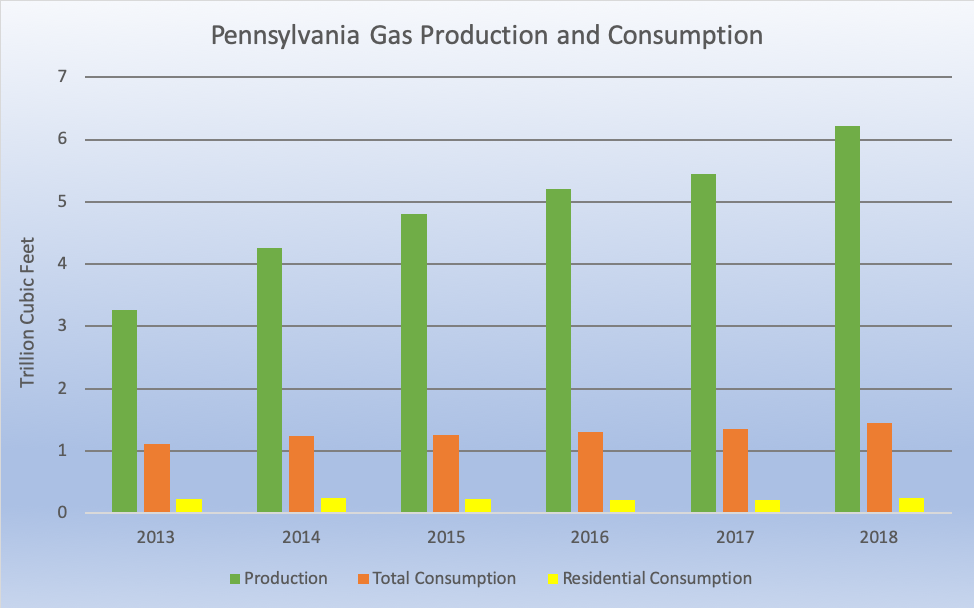
By means of comparison, Pennsylvania consumed about 1.46 Tcf of gas across all sectors in 2018, of which just 253 billion cubic feet (Bcf) was used in the homes of Pennsylvania’s 12.8 million residents. In fact, the amount of gas produced in Pennsylvania exceeds residential consumption in the entire United States by almost 1.7 Tcf. However, less than 17% of all gas consumed in Pennsylvania is for residential use, with nearly 28% being used for industrial purposes (including petrochemical development), and more than 35% used to generate electricity.

Fracked Gas Production and Consumption in Pennsylvania from 2013 through 2018

Figure 1. Fracked gas production compared to all fracked gas consumption and residential gas consumption in Pennsylvania from 2013 through 2018. Data from ref. Energy Information Administration.


While gas production has expansive hotspots in the northeastern and southwestern portions of the state, the liquid production comes from a much more limited geography. Eighty percent of all condensate production came from Washington County, while 87% of all fracked oil came from wells in Mercer County.

Because the definition of condensate has been somewhat controversial in the past (while the oil export ban was still in effect), I asked the Department of Environmental Protection (DEP) for the definition, and was told that if hydrocarbons come out of the well as a liquid, they should be reported as oil. If they are gaseous but condense to a liquid at standard temperature and pressure (60 degrees Fahrenheit and pressure 14.7 PSIA) on-site, then it is to be reported as condensate. Any NGLs that remain gaseous but are removed from the gas supply further downstream are reported as gas in this report. For this reason, it is not really possible to use the production report to find specific amounts of NGLs produced in the state, but it certainly exceeds condensate production by an appreciable margin.

The one-year volume withdrawal of gas from unconventional wells in Pennsylvania is equal to the volume of 3.2 Mount Everests

The volume of gas withdrawn from fracked wells in Pennsylvania in just one year is equal to the volume of 3.2 Mount Everests!


Waste

Hydrocarbons aren’t the only thing that come out of the ground when operators drill and frack wells in Pennsylvania. Drillers also report a staggering amount of waste products, including more than 65 million barrels (2.7 billion gallons) of liquid waste and 1.2 million tons of solid waste in the 12-month period.

Waste facilities have significant issues such as inducing earthquakes, toxic leachate, and radioactive sediments in streambeds.

Waste Type Liquid Waste (Barrels) Solid Waste (Tons)
Basic Sediment 63
Brine Co-Product 247
Drill Cuttings 1,094,208
Drilling Fluid Waste 1,439,338 11,378
Filter Socks 143
Other Oil & Gas Wastes 2,236,750 6,387
Produced Fluid 61,376,465 41,165
Servicing Fluid 17,196 3,250
Soil Contaminated by Oil & Gas Related Spills 25,505
Spent Lubricant Waste 1,104
Synthetic Liner Materials 21,051
Unused Fracturing Fluid Waste 7,077 1,593
Waste Water Treatment Sludge 35,151
Grand Total 65,078,240 1,239,831

Figure 2. Oil and gas waste generated by fracked wells as reported by drillers from November 1, 2018 through October 31, 2019. Data from ref: PA DEP.

Some of the waste is probably best described as sludge, and several of the categories allow for reporting in barrels or tons. Almost all of the waste was in the well bore at one time or another, although there are some site-related materials that need to be disposed of, including filter socks which separate liquid and solid waste, soils contaminated by spills, spent lubricant, liners, and unused frack fluid waste.

Where does all of this waste go? We worked with Earthworks earlier this year to take a deep dive into the data, focusing on these facilities that receive waste from Pennsylvania’s oil and gas wells. While the majority of the waste is dealt with in-state, a significant quantity crosses state lines to landfills and injection wells in neighboring states, and sometimes as far away as Idaho.

Please see the report, Pennsylvania Oil & Gas Waste for more details.


Drilled Wells

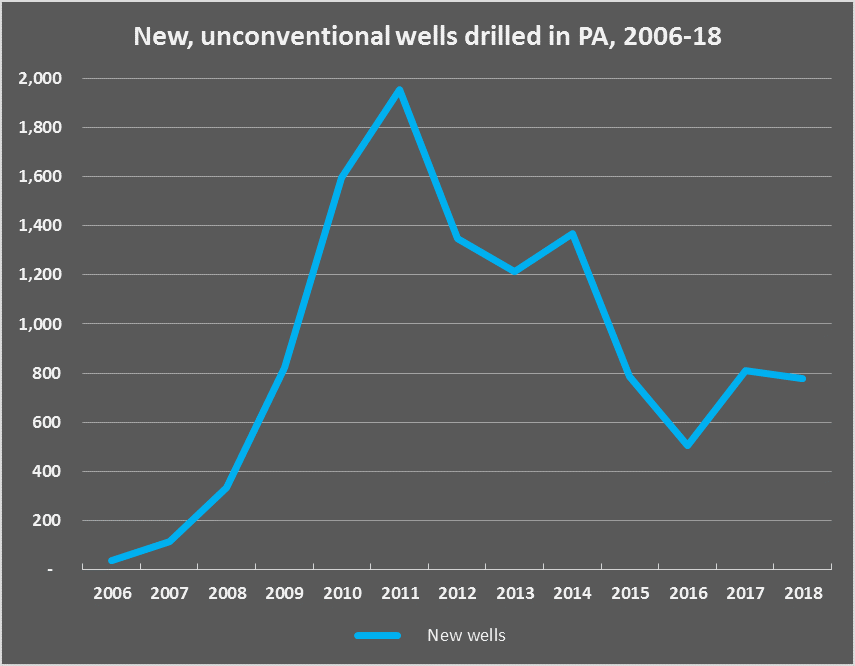
Oil and gas operators have started the drilling process for 616 fracking wells in 2019, which appear on the Pennsylvania DEP spud report. This is less than one third of the 2011 peak of 1,956 fracked wells, and 2019 is the fifth consecutive year with fewer than 1,000 wells drilled. This has the effect of making industry projections relying on 1,500 or more drilled wells per year seem rather dubious.


Fracked Unconventional Wells Drilled per Year in Pennsylvania from 2005 through 2019

Figure 3. Unconventional (fracked) wells drilled from 2005 through December 23, 2019, showing totals by regional office. Data from ref: PA DEP.


Oil and gas wells in Pennsylvania fall under the jurisdiction of three different regional offices. By looking at Figure 2, it becomes apparent that the North Central Regional Office (blue line) was a huge driver of the 2009 to 2014 drilling boom, before falling back to a similar drilling rate of the Southwest Regional Office.

The slowdown in drilling for gas in recent years is related to the lack of demand for the product. In turn, this drives prices down, a phenomenon that industry refers to as a “price glut.” The situation it is forcing major players in the regions such as Range Resources to reduce their holdings in Appalachia, and some, such as Chevron, are pulling out entirely.

Violations

Disturbingly, 2019 was the fifth straight year that the number of violations issued by DEP will exceed the total number of wells drilled.

Unconventional fracked wells drilled and violations issued from 2005 through 2019

Figure 4. Unconventional (fracked) drilled wells and issued violations from 2005 through December 2019. Data from ref: DEP.


Violations related to unconventional drilling are a bit unwieldy to summarize. The 13,833 incidents reported in Pennsylvania fall into 359 different categories, representing the specific regulations in which the drilling operator fell short of expectations. The industry likes to dismiss many of these as being administrative matters, and indeed, the DEP does categorize the violations as either “Administrative” or “Environmental, Health & Safety”. However, 9,998 (72%) of the violations through December 3, 2019, are in the latter category, and even some of the ones that are categorized as administrative seem like they ought to be in environmental, health, and safety. For example, let’s look at the 15 most frequent infractions:

Violation Code Incidents Category
SWMA301 – Failure to properly store, transport, process or dispose of a residual waste. 767 Environmental Health & Safety
CSL 402(b) – POTENTIAL POLLUTION – Conducting an activity regulated by a permit issued pursuant to Section 402 of The Clean Streams Law to prevent the potential of pollution to waters of the Commonwealth without a permit or contrary to a permit issued under that authority by the Department. 613 Environmental Health & Safety
102.4 – Failure to minimize accelerated erosion, implement E&S plan, maintain E&S controls. Failure to stabilize site until total site restoration under OGA Sec 206(c)(d) 595 Environmental Health & Safety
SWMA 301 – MANAGEMENT OF RESIDUAL WASTE – Person operated a residual waste processing or disposal facility without obtaining a permit for such facility from DEP. Person stored, transported, processed, or disposed of residual waste inconsistent with or unauthorized by the rules and regulations of DEP. 540 Environmental Health & Safety
601.101 – O&G Act 223-General. Used only when a specific O&G Act code cannot be used 469 Administrative
402CSL – Failure to adopt pollution prevention measures required or prescribed by DEP by handling materials that create a danger of pollution. 362 Environmental Health & Safety
78.54* – Failure to properly control or dispose of industrial or residual waste to prevent pollution of the waters of the Commonwealth. 339 Environmental Health & Safety
401 CSL – Discharge of pollutional material to waters of Commonwealth. 299 Environmental Health & Safety
102.4(b)1 – EROSION AND SEDIMENT CONTROL REQUIREMENTS – Person conducting earth disturbance activity failed to implement and maintain E & S BMPs to minimize the potential for accelerated erosion and sedimentation. 285 Environmental Health & Safety
102.5(m)4 – PERMIT REQUIREMENTS – GENERAL PERMITS – Person failed to comply with the terms and conditions of the E & S Control General Permit. 283 Environmental Health & Safety
78.56(1) – Pit and tanks not constructed with sufficient capacity to contain pollutional substances. 256 Administrative
78a53 – EROSION AND SEDIMENT CONTROL AND STORMWATER MANAGEMENT – Person proposing or conducting earth disturbance activities associated with oil and gas operations failed to comply with 25 Pa. Code § 102. 247 Environmental Health & Safety
102.11(a)1 – GENERAL REQUIREMENTS – BMP AND DESIGN STANDARDS – Person failed to design, implement and maintain E & S BMPs to minimize the potential for accelerated erosion and sedimentation to protect, maintain, reclaim and restore water quality and existing and designated uses. 235 Environmental Health & Safety
CSL 401 – PROHIBITION AGAINST OTHER POLLUTIONS – Discharged substance of any kind or character resulting in pollution of Waters of the Commonwealth. 235 Environmental Health & Safety
OGA3216(C) – WELL SITE RESTORATIONS – PITS, DRILLING SUPPLIES AND EQUIPMENT – Failure to fill all pits used to contain produced fluids or industrial wastes and remove unnecessary drilling supplies/equipment not needed for production within 9 months from completion of drilling of well. 206 Environmental Health & Safety

Figure 5. Top 15 most frequently cited violations for unconventional drilling operations in Pennsylvania through December 3, 2019. Data from ref: DEP.

Of the 15 most common categories, only two are considered administrative violations. One of these is a general code, where we don’t know what happened to warrant the infraction without reading the written narrative that accompanies the data, and is therefore impossible to categorize. The only other administrative violation in the top 15 categories reads, “78.56(1) – Pit and tanks not constructed with sufficient capacity to contain pollutional substances,” which certainly sounds like it would have some real-world implications beyond administrative concerns.

Check out our Pennsylvania Shale Viewer map to see if there are violations at wells near you.

Bloated With Gas, Fraught With Trouble

To address the excess supply of gas, companies have tried to export the gas and liquids to other markets through pipelines. Those efforts have been fraught with trouble as well. Residents are reluctant to put up with an endless barrage of new pipelines, yielding their land and putting their safety at risk for an industry that can’t seem to move the product safely. The Revolution pipeline explosion hasn’t helped that perception, nor have all of the sinkholes and hundreds of leaky “inadvertent returns” along the path of the Mariner East pipeline system. In a sense, the industry’s best case scenario is to call these failures incompetence, because otherwise they would be forced to admit that the 2.5 million miles of hydrocarbon pipelines in the United States are inherently risky, prone to failure any time and any place.

In addition to increasing the transportation and export of natural gas to new markets, private companies and elected officials are collaborating to attract foreign investors to fund a massive petrochemical expansion in the Ohio River Valley. The planned petrochemical plants intend to capitalize on the cheap feedstock of natural gas.

Pennsylvania’s high content of NGLs is a selling point by the industry, because they have an added value when compared to gas. While all of these hydrocarbons can burn and produce energy in a similar manner, operators are required to remove most of them to get the energy content of the gas into an acceptable range for gas transmission lines. Because of this, enormous facilities have to be built to separate these NGLs, while even larger facilities are constructed to consume it all. Shell’s Pennsylvania Petrochemicals Complex ethane cracker being built in Beaver County, PA is scheduled to make 1.6 million metric tons of polyethylene per year, mostly for plastics.

This comes at a time when communities around the country and the world are enacting new regulations to rein in plastic pollution, which our descendants are going to finding on the beach for thousands of years, even if everyone on the planet were to stop using single-use plastics today. Of course, none of these bans or taxes are currently permitted in Pennsylvania, but adding 1.6 million metric tons per year to our current supply is unnecessary, and indeed, it is only the beginning for the region. A similar facility, known as the PTT Global Chemical cracker appears to be moving forward in Eastern Ohio, and ExxonMobil appears to be thinking about building one in the region as well. Industry analysts think the region produces enough NGLs to support five of these ethane crackers.

Despite all of these problems, the oil and gas industry still plans to fill the Ohio River Valley with new petrochemical plants, gas processing plants, and storage facilities in the hopes that someday, somebody may want what they’ve taken from the ground.

Here’s hoping that 2020 is a safer and healthier year than 2019 was. But there is no need to leave it up to chance. Together, we have the power to change things, if we all demand that our voices are heard. As a start, consider contacting your elected officials to let them know that renewing Pennsylvania’s blocking of municipal bans and taxes on plastic bags is unacceptable.

By Matt Kelso, Manager of Data & Technology, FracTracker Alliance


Support this work

`

DONATE

Stay in the know

Fracking Threatens Ohio’s Captina Creek Watershed

FracTracker’s Great Lakes Program Coordinator Ted Auch explores the risks and damages brought on by fracking in Ohio’s Captina Creek Watershed


Scroll down or click here to view the story map full screen

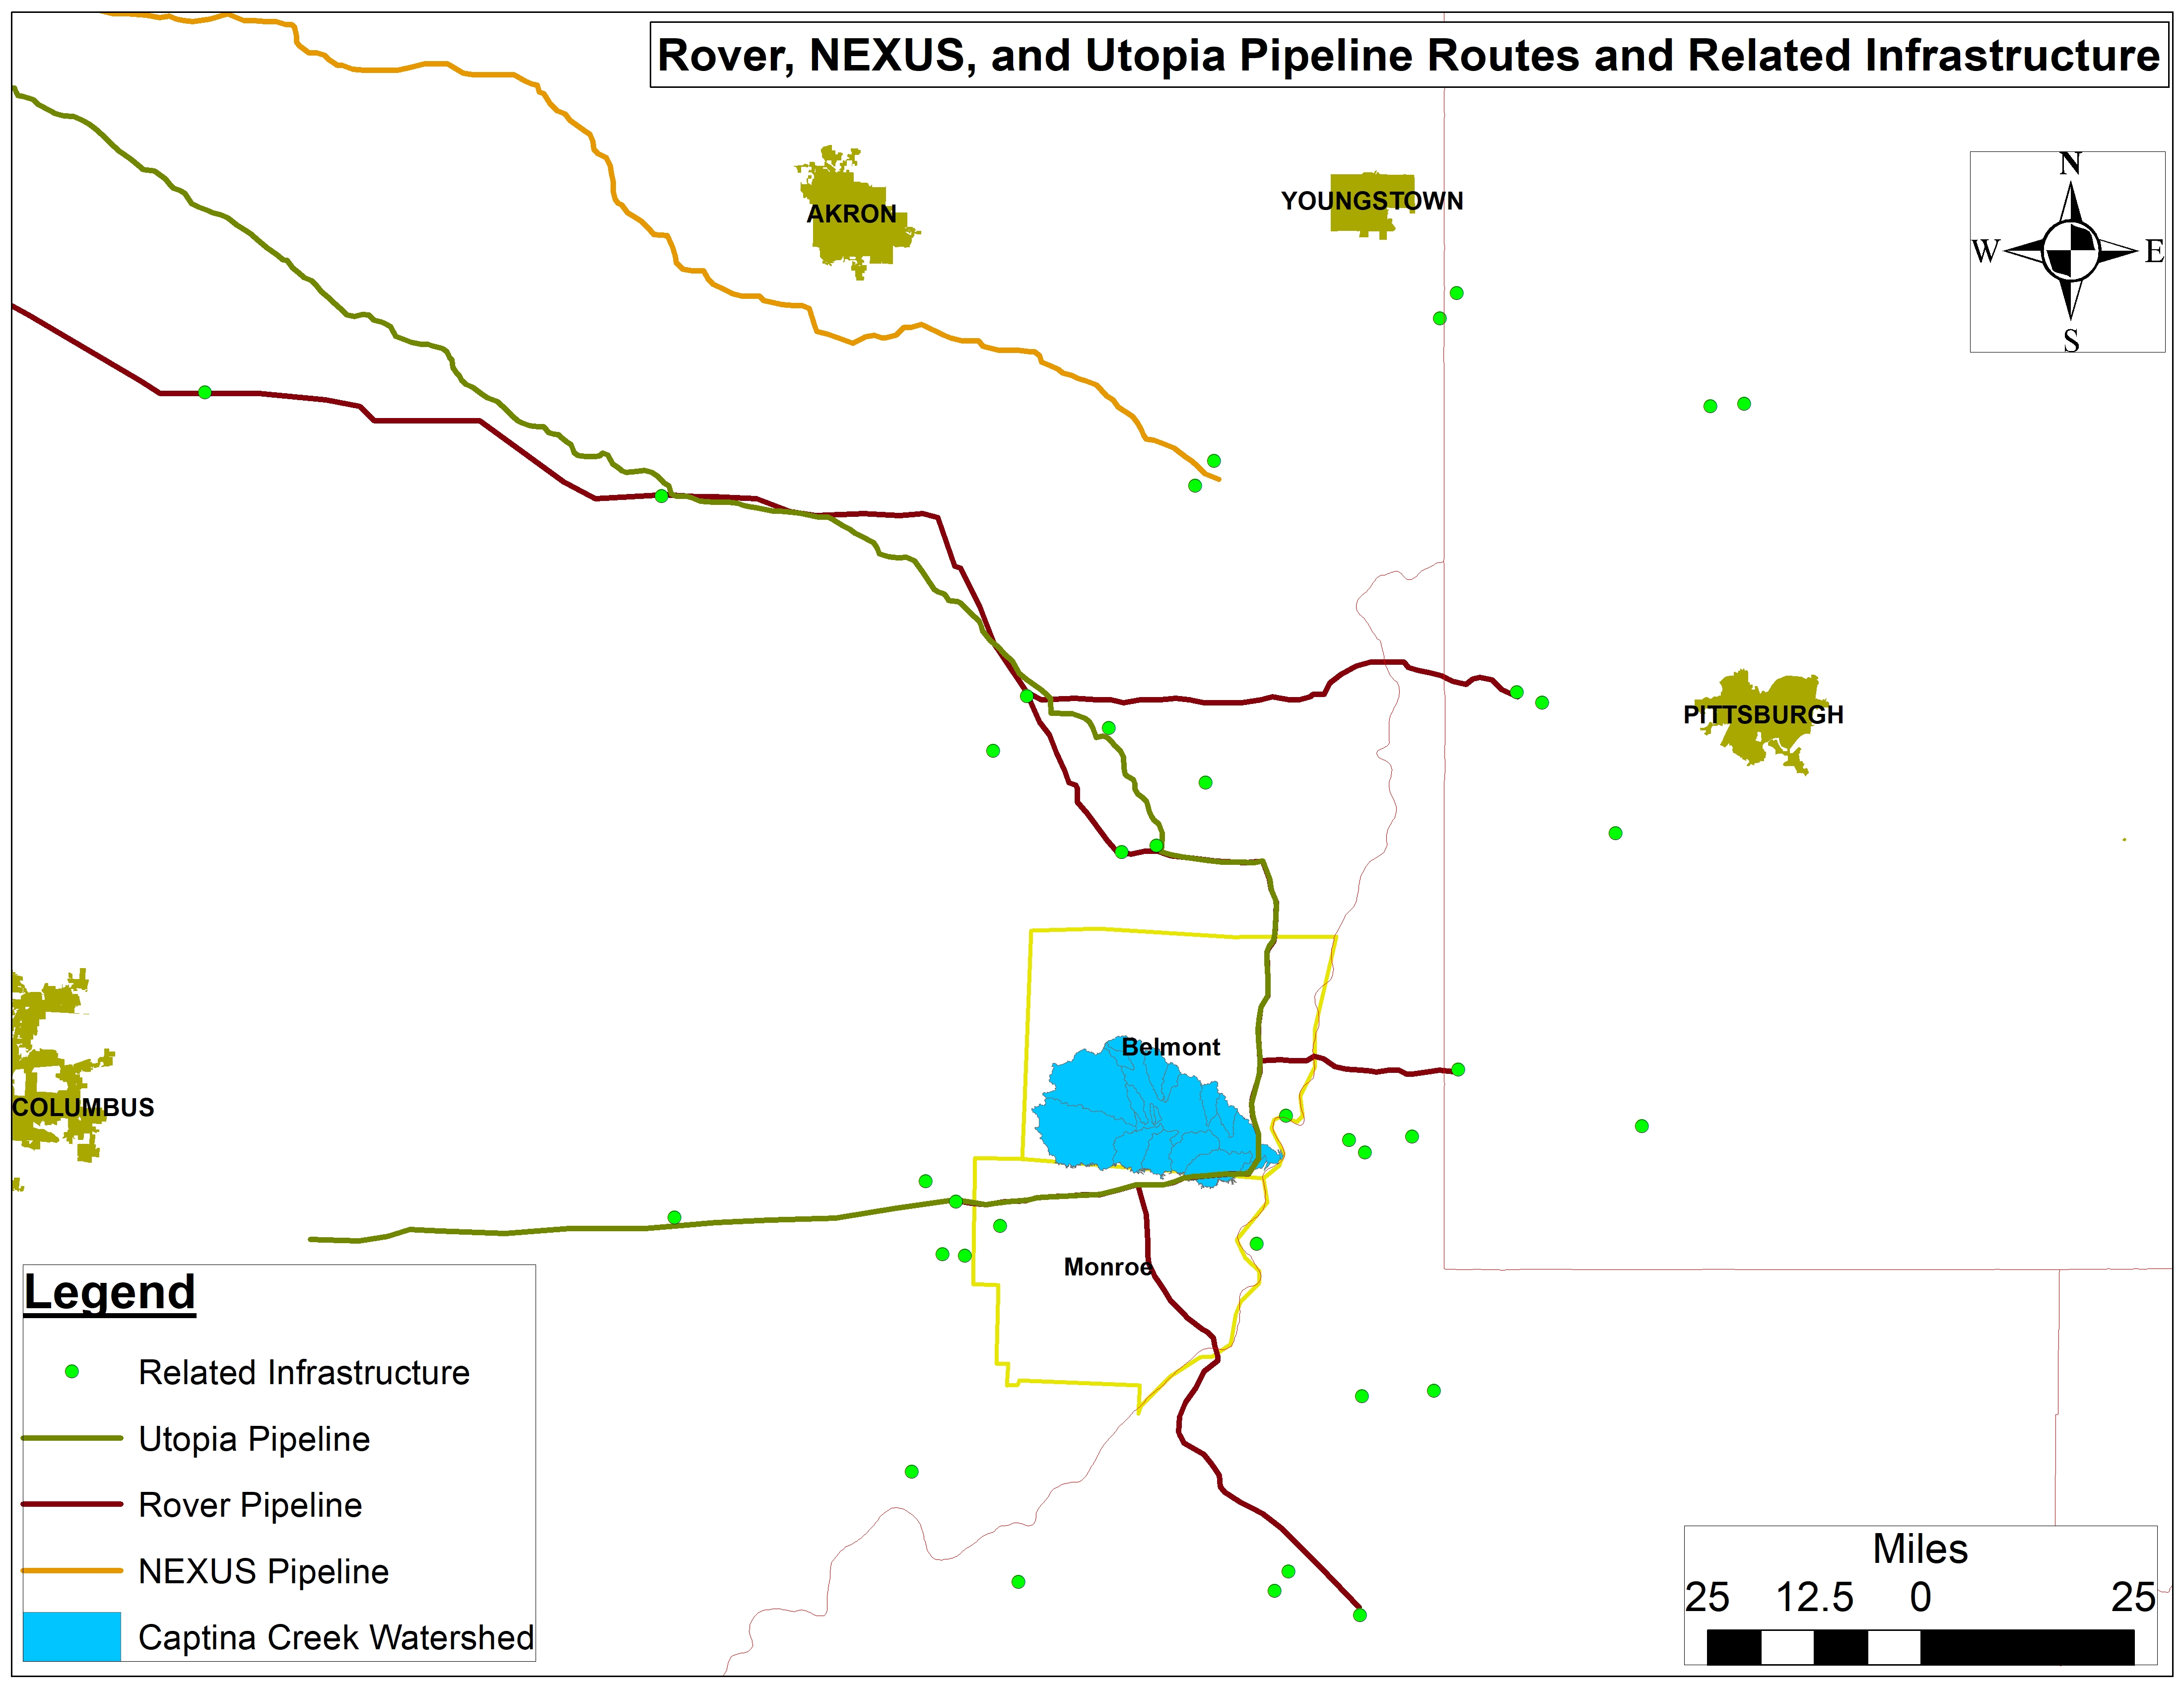
The Captina Creek Watershed straddles the counties of Belmont and Monroe in Southeastern Ohio and feeds into the Ohio River. It is the highest quality watershed in all of Ohio and a great examples of what the Ohio River Valley’s tributaries once looked, smelled, and sounded like. Sadly, today it is caught in the cross-hairs of the oil and gas industry by way of drilling, massive amounts of water demands, pipeline construction, and fracking waste production, transport, and disposal. The images and footage presented in the story map below are testament to the risks and damage inherent to fracking in the Captina Creek watershed and to this industry at large. Data included herein includes gas gathering and interstate transmission pipelines like the Rover, NEXUS, and Utopia (Figure 1), along with Class II wastewater injection wells, compressor stations, unconventional laterals, and freshwater withdrawal sites and volumes.

Ohio Rover NEXUS Pipelines map

The image at the top of the page captures my motivation for taking a deeper dive into this watershed. Having spent 13+ years living in Vermont and hiking throughout The Green and Adirondack Mountains, I fell in love with the two most prominent tree species in this photo: Yellow Birch (Betula alleghaniensis) and Northern Hemlock (Tsuga candadensis). This feeling of being at home was reason enough to be thankful for Captina Creek in my eyes. Seeing this region under pressure from the oil and gas industry really hit me in my botanical soul. We remain positive with regards to the area’s future, but protective action against fracking in the Captina Creek Watershed is needed immediately!

Fracking in the Captina Creek Watershed: A Story Map

Go to the story map fullscreen for a better viewing experience

Support this work

`

DONATE

Stay in the know

Want Not, Waste Not? Fossil Fuel Extraction’s Waste Disposal Challenges

Pennsylvania’s fracking industry is producing record amounts of toxic waste — where does it all go?

Drilling for methane and other fossil fuels is an energy-intensive process with many associated environmental costs. In addition to the gas that is produced through high volume hydraulic fracturing (“unconventional drilling,” or “fracking”), the process generates a great deal of waste at the drill site. These waste products may include several dozen tons of drill cutting at every well that is directionally drilled, in addition to liner materials, contaminated soil, fracking fluid, and other substances that must be removed from the site.

In 2018, Pennsylvania’s oil and gas industry (including both unconventional and conventional wells) produced over 2.9 billion gallons (nearly 69 million barrels) of liquid waste, and 1,442,465 tons of solid waste. In this article, we take a look at where this waste (and its toxic components) end up and how waste values have changed in recent years. We also explore how New York State, despite its reputation for being anti-fracking, isn’t exempt from the toxic legacy of this industry.

Waste that comes back to haunt us

According to a study by Physicians, Scientists and Engineers, over 80% of all waste from oil and gas drilling stays within the state of Pennsylvania. But once drilling wastes are sent to landfills, is that the end of them? Absolutely not!

Drilling waste also gets into the environment through secondary means. According to a recent report by investigative journalists at Public Herald, on average, 800,000 tons of fracking waste from Pennsylvania is sent to Pennsylvania landfills. When this waste is sent to landfills, radioactivity and other chemicals can percolate through the landfill, and are collected as leachate, which is then shipped to treatment plants.

Public Herald documented how fourteen sewage treatment plants in Pennsylvania have been permitted by Pennsylvania’s Department of Environmental Protection (PA DEP) to process and discharge radioactive wastes into more than a dozen Pennsylvania waterways.

Public Herald’s article includes an in-depth analysis of the issue. Their work is supported by a map of the discharge sites, created by FracTracker.

Trends over time

Pennsylvania Department of Environmental Protection maintains a rich database of oil and gas waste and production records associated with their Oil and Gas Reporting Website. The changes in waste disposal from Pennsylvania’s unconventional drilling reveal a number of interesting stories.

Let’s look first at overall unconventional drilling waste.

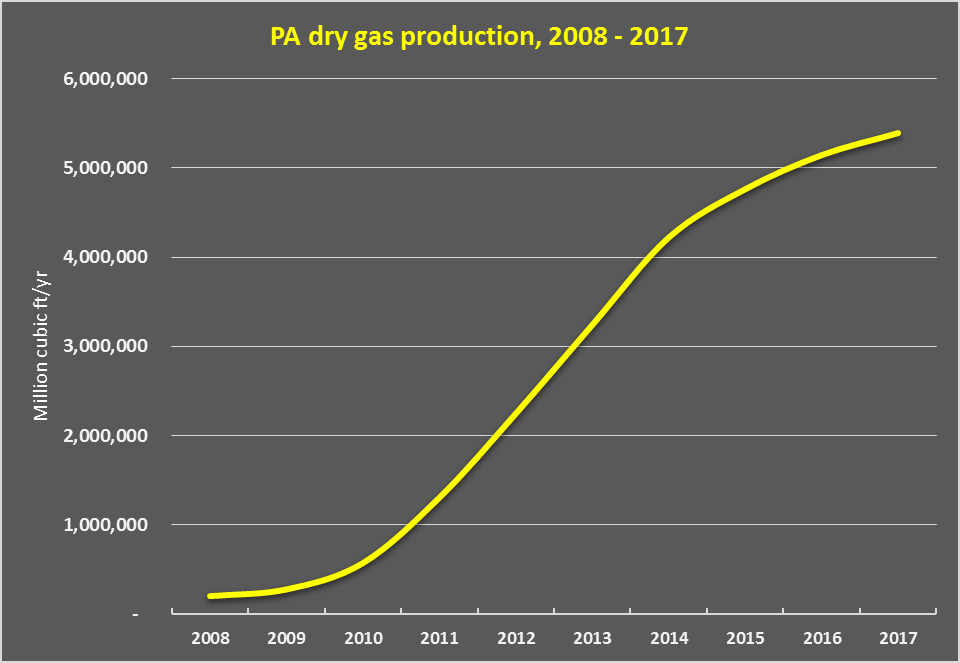
According to data from the federal Energy Information Administration, gas production in Pennsylvania began a steep increase around 2010, with the implementation of high volume hydraulic fracturing in the Marcellus Shale (see Figure 1). The long lateral drilling techniques allowed industry to exploit exponentially more of the tight shale via single well than was ever before possible with conventional, vertical drilling.

Figure 1. Data summary from FracTracker.org, based on EIA data.

The more recently an individual well is drilled, the more robust the production. We see an overall increase in gas production over time in Pennsylvania over the past decade. Paradoxically, the actual number of new wells drilled each year in the past 4-5 years are less than half of the number drilled in 2011 (see Figure 2).

Figure 2: Data summary from FracTracker.org, based on PA DEP data

Why is this? The longer laterals —some approaching 3 miles or more—associated with new wells allow for more gas to be extracted per site.

With this uptick in gas production values from the Marcellus and Utica Formations come more waste products, including copious amounts drilling waste, “produced water,” and other byproducts of intensive industrial operations across PA’s Northern Tier and southwestern counties.

Comparing apples and oranges?

When we look at the available gas production data compared with data on waste products from the extraction process, some trends emerge. First of all, it’s readily apparent that waste production does not track directly with gas production in a way one would expect.

Recall that dry gas production has increased annually since 2006 (see Figure 1). However, the reported waste quantities from industry have not followed that same trend.

In the following charts, we’ve split out waste from unconventional drilling by solid waste in tons (Figure 3) and liquid waste, in barrels (Figure 4).

Figure 3: Annual tonnage of solid waste from the unconventional oil and gas industry, organized by the state it is disposed in. Data source: PA DEP, processed by FracTracker Alliance

Figure 4: Annual volume of liquid waste from the unconventional oil and gas development, organized by state it is disposed in. One barrel is equivalent to 42 gallons. Data source: PA DEP, processed by FracTracker Alliance

Note the striking difference in disposal information for solid waste, compared with liquid waste, coming from Pennsylvania.

“Disposal Location Unknown”

Until just the last year, often more than 50% of the known liquid waste generated in PA was disposed of at unknown locations. The PA DEP waste report lists waste quantity and method for these unknown sites, depending on the year: “Reuse without processing at a permitted facility,” “Reuse for hydraulic fracturing,” “Reuse for diagnostic purposes,” “Reuse for drilling or recovery,” “Reuse for enhanced recovery,” and exclusively in more recent years (2014-2016), “Reuse other than road-spreading.”

In 2011, of the 20.5 million barrels of liquid waste generated from unconventional drilling, about 56% was allegedly reused on other drilling sites. However, over 9 million barrels—or 44% of all liquid waste—were not identified with a final destination or disposal method. Identified liquid waste disposal locations included “Centralized treatment plant for recycle,” which received about a third of the non-solid waste products.

In 2012, the quantity of the unaccounted-for fracking fluid waste dropped to about 40%. By 2013, the percentage of unaccounted waste coming from fracking fluid dropped to just over 21%, with nearly 75% coming from produced fluid, which is briny, but containing fewer “proprietary”—typically undisclosed—chemicals.

By 2017, accounting had tightened up further. PA DEP data show that 99% of all waste delivered to undisclosed locations was produced fluid shipped to locations outside of Pennsylvania. By 2018, all waste disposal was fully accounted for, according to DEP’s records.

In looking more closely at the data, we see that:

  1. Prior to 2018, well drillers did not consistently report the locations at which produced water was disposed of or reused. Between 2012 and 2016, a greater volume of unconventional liquid waste went unaccounted for than was listed for disposal in all other locations, combined.
  2. In Ohio, injection wells, where liquid waste is injected into underground porous rock formations, accounted for the majority of the increase in waste accepted there: 2.9 million barrels in 2017, and 5.7 million barrels in 2018 (a jump of 97%).
  3. West Virginia’s acceptance of liquid waste increased  significantly in 2018 over 2017 levels, a jump of over a million barrels, up from only 55,000. This was almost entirely due to unreported reuse at well pads.
  4. In 2018, reporting, in general, appears to be more thorough than it was in previous years. For example, in 2017, nearly 692,000 barrels of waste were reused at well pads outside PA, but those locations were not disclosed. Almost 7000 more barrels were also disposed of at unknown locations. In 2018, there were no such ambiguities.

A closer look at Pennsylvania’s fracking waste shipped to New York State

Despite a reputation for being resistant to the fracking industry, for most of this decade, the state of New York has been accepting considerable amounts of fracking waste from Pennsylvania. The greatest percentage shipped to New York State is in the form of drilling waste solids that go to a variety of landfills throughout Central and Western New York.

Looking closely at the bar charts above, it’s easy to notice that the biggest recipients of Pennsylvania’s unconventional liquid drilling waste are Pennsylvania itself, Ohio, as well as a significant quantity of unaccounted-for barrels between 2011 and 2016 (“Disposal location unknown”). The data for disposal of solid waste in New York tells a different story, however. In this case, Pennsylvania, Ohio, and New York State all play a role. We’ll take a look specifically at the story of New York, and illustrate the data in the interactive map that follows.

In this map, source locations in Pennsylvania are symbolized with the same color marker as the facility in New York that received the waste from the originating well pad. In the “Full Screen” view, use the “Layers” drop down menu to turn on and off data from separate years.

View map full screenHow FracTracker maps work

Solid waste transported to New York State

From the early days of unconventional drilling in Pennsylvania, New York State’s landfills provided convenient disposal sites due to their proximity to the unconventional drilling occurring in Pennsylvania’s Northern tier of counties. Pennsylvania and Ohio took the majority of solid wastes from unconventional drilling waste from Pennsylvania. New York State, particularly between 2011-2015, was impacted far more heavily than all other states, combined (Figure 5, below).

Figure 5: Known disposal locations (excluding PA and OH) of Pennsylvania’s solid waste. Data source: PA DEP, processed by FracTracker Alliance

Here’s the breakdown of locations in New York to where waste was sent. Solid waste disposal into New York’s landfills also dropped by half, following the state’s ban on unconventional drilling in 2014. Most of the waste after 2012 went to the Chemung County Landfill in Lowman, New York, 10 miles southeast of Elmira.

Figure 6: Solid waste from unconventional drilling, sent to facilities in NYS. Data source: PA DEP, processed by FracTracker Alliance

Is waste immobilized once it’s landfilled?

The fate of New York State’s landfill leachate that originates from unconventional drilling waste is a core concern, since landfill waste is not inert. If drilling waste contains radioactivity, fracking chemicals, and heavy metals that percolate through the landfill, and the resulting leachate is sent to municipal wastewater treatment plants, will traditional water treatment methods remove those wastes? If not, what will be the impact on public and environmental health in the water body that receives the “treated” wastewater? In Pennsylvania, for example, a case is currently under investigation relating to pollution discharges into the Monongahela River near Pittsburgh. “That water was contaminated with diesel fuels, it’s alleged, carcinogens and other pollutants,” said Rich Bower, Fayette County District Attorney.

Currently, a controversial expansion of the Hakes Landfill in Painted Post, New York is in the news. Sierra Club and others were concerned about oversight of radium and radon in the landfill’s leachate and air emissions, presumably stemming from years of receiving drill cuttings. The leachate from the landfill is sent to the Bath Wastewater Treatment plant, which is not equipped to remove radioactivity. “Treated” wastewater from the plant is then discharged into the Cohocton River, a tributary of the Chesapeake Bay. In April 2019, these environmental groups filed a law suit against Hakes C&D Landfill and the Town of Campbell, New York, in an effort to block the expansion.

Similar levels of radioactivity in leachate have also been noted in leachate produced at the Chemung County Landfill, according to Gary McCaslin, President of People for a Healthy Environment, Inc.

In recent years, much of the solid unconventional waste arriving in New York State has gone to the Chemung County Landfill (see Figure 6, above). Over the course of several years, this site requested permission to expand significantly from 180,000 tons per year to 417,000 tons per year. However, by 2016, the expansion was deemed unnecessary, and according, the plans were put on hold, in part “…because of a decline in the amount of waste being generated due to a slower economy and more recycling than when the expansion was first planned years ago.” The data in Figure 5 above also parallel this story, with unconventional drilling waste disposed in New York State dropping from over 200,000 tons in 2011 to just over 20,000 tons in 2018.

Liquid waste transported to New York State

The story about liquid unconventional drilling waste exported from Pennsylvania to states other than Ohio is not completely clear (see Figure 7, below). Note that the data indicate more than a 2000% increase in waste liquids going from Pennsylvania to West Virginia after 2017. While it has not been officially documented, FracTracker has been anecdotally informed that a great deal of waste was already going to West Virginia, but that the record-keeping prior to 2018 was simply not strongly enforced.

Figure 7: Known disposal locations (excluding Pennsylvania and Ohio) of Pennsylvania’s liquid waste. Data source: PA DEP, processed by FracTracker Alliance

Beginning in the very early years of the Pennsylvania unconventional fracking boom, a variety of landfills in New York State have also accepted liquid wastes originating in Pennsylvania, including produced water and flowback fluids (see Figure 8, below).

Figure 8: Liquid waste from unconventional drilling, sent to facilities in New York State. Data source: PA DEP, processed by FracTracker Alliance

In addition, while this information doesn’t even appear in the PA DEP records (which are publicly available back to 2010), numerous wastewater treatment plants did accept some quantity, despite being fully unequipped to process the highly saline waste before it was discharged back into the environment.

One such facility was the wastewater treatment plant in Cayuga Heights, Tompkins County, which accepted more than 3 million gallons in 2008. Another was the wastewater treatment plant in Auburn, Cayuga County, where the practice of accepting drilling wastewater was initially banned in July 2011, but the decision was reversed in March 2012 to accept vertical drilling waste, despite strong public dissent. Another wastewater treatment plant in Watertown, Jefferson County, accepted 35,000 gallons in 2009.

Fortunately, most New York State wastewater treatment plant operators were wise enough to not even consider adding a brew of unknown and/or proprietary chemicals to their wastewater treatment stream. Numerous municipalities and several counties banned fracking waste, and once the ban on fracking in New York State was instituted in 2014, nearly all importation of liquid unconventional drilling waste into the state ceased.

Nevertheless, conventional, or vertical well drilling also generates briny produced water, which the New York State Department of Environmental Conservation (DEC) permits communities in New York to accept for ice and dust control on largely rural roads. These so-called “beneficial use determinations” (BUDs) of liquid drilling waste have changed significantly over the past several years. During the height of the Marcellus drilling in around 2011, all sorts of liquid waste was permitted into New York State (see FracTracker’s map of affected areas) and was spread on roads. As a result, the chemicals—many of them proprietary, of unknown constituents, or radioactive—were indirectly discharged into surface waters via roadspreading.

Overall, in the years after the ban in 2014 on high volume hydraulic fracturing was implemented, restrictions on Marcellus waste coming into New York have strengthened. Very little liquid waste entered New York’s landfills after 2013, and what did come in was sent to a holding facility owned by Environmental Services of Vermont. This facility is located outside Syracuse, New York.

New York State says “no” to this toxic legacy

Fortunately, not long after these issues of fracking fluid disposal at wastewater treatment facilities in New York State came to light, the practice was terminated on a local level. The 2014 ban on fracking in New York State officially prevented the disposal of Marcellus fluids in municipal wastewater treatment facilities and required extra permits if it were to be road-spread.

In New York State, the State Senate—after 8 years of deadlock—in early May 2019, passed key legislation that would close a loophole that had previously allowed dangerous oil and gas waste to bypass hazardous waste regulation. Read the press release from Senator Rachel May’s office here. However, despite strong support from both the Senate, and the Assembly, as well as many key environmental groups, the Legislature adjourned for the 2019 session without bringing the law to a final vote. Said Elizabeth Moran, of the New York Public Interest Research Group (NYPIRG), “I want to believe it was primarily a question of timing… Sadly, a dangerous practice is now going to continue for at least another year.”


See Earthworks’ recent three part in-depth reporting on national, New York, and Pennsylvania oil and gas waste, with mapping support by FracTracker Alliance.

All part of the big picture

As long as hydrocarbon extraction continues, the issues of waste disposal—in addition to carbon increases in the atmosphere from combustion and leakage—will result in impacts on human and environmental health. Communities downstream and downwind will bear the brunt of landfill expansions, water contamination, and air pollution. Impacts of climate chaos will be felt globally, with the greatest impacts at low latitudes and in the Arctic.

Transitioning to net-zero carbon emissions cannot be a gradual endeavor. Science has shown that in order to stay under the 1.5 °C warming targets, it must happen now, and it requires the governmental buy-in to the Paris Climate Agreement by every economic power in the world.

No exceptions. Life on our planet requires it.

We have, at most, 12 years to make a difference for generations to come.

By Karen Edelstein, Eastern Program Coordinator, FracTracker Alliance

Support this work

`

DONATE

Stay in the know

Fair Shake Environmental Legal Services

Guest Blog by Josh Eisenfeld, Director of Marketing with Fair Shake Environmental Legal Services


Fair Shake Environmental Legal Services looks maps the origin of their intake calls and reflects on their geographic distribution as it relates to areas with heavy environmental burdens.


Over the last five years, Fair Shake Environmental Legal Services has worked in Ohio and Pennsylvania to promote environmental justice by providing legal services at income-based rates. Our service area has a long history of extraction, from timbering, conventional drilling for oil, multiple forms of mining, and unconventional drilling for natural gas. Because of our proximity to these resources, we also have a long history of industrial manufacturing, which can be evidenced by the many oil refineries, steel production facilities, power plants, cement factories, factory farms, and chemical production facilities. Fair Shake offers counsel and representation in environmental law with accessible, sliding scale fees, and we receive a continuous stream of phone calls from those on the front lines. We were curious to see if our intake calls correlated with geographic areas with heavy environmental burdens in order to allocate our limited resources to those regions most efficiently.

With the help of Ted Auch from FracTracker Alliance we collected zip codes from nearly 600 of intake calls received by Fair Shake and placed them on the map below.


View map fullscreen | How FracTracker maps work

In general, our intakes in Pennsylvania mirror the Marcellus Shale formation. Over the last decade and a half, technical advancements in drilling have transformed the Marcellus Shale formation from a nonproducing region to the largest producing natural gas formation by volume in the world. Entering 2005, only 13 “unconventional” wells had been drilled in the Marcellus Shale region of Pennsylvania, where today there are roughly 12,000 wells according to FracTracker’s PA Shale Viewer Map. Reduced regulations for unconventional drilling and infrastructure have facilitated this rush for production, resulting in an influx of compressor stations, gathering lines, pump stations, processing plants, wastewater impoundments, wastewater treatment facilities, wastewater injection wells, and more.

We believe that this map indicates that these 12,000 wells place a significant burden on residents living within this region. Speaking broadly, reduced regulation has left loopholes in major environmental laws that have to get justice when their rights have been violated and, even more concerning, when harm has occurred.

One of the most prominent manifestations of this burden is the contamination of private drinking water sources near drilling and wastewater sites. Our region’s history of extraction and industrial enterprise and the pollution associated with these industries makes it extremely difficult to prove, in court, that drilling activity is the sole cause of damage to private wells. The fact is that our groundwater (and therefore private drinking wells) has been contaminated over and over again. Polluters use this to their advantage, leaning on the uncertainty of what caused the contaminants in question to get there. Simply put, water contamination is not a question of whether contaminants exist (they do) it’s a question of how can you prove that it was a given industry when there are many other possible culprits.

One thing we do know is that the number of reports for well contamination has increased in conjunction with the increase in drilling activity. The graph below, created by FracTracker and The Public Herald, shows the correlation of wells drilled, complaints to the Department of Environmental Protection, and complaints specifically about water.


Upon closer examination of the intake map, we saw a higher density of cases in more populated areas of Allegheny County, which actually has very little fracking activity (less than 170 drilled wells). But Allegheny is also one of the most polluted counties in America. The American Lung Association gave the county all F’s on its air quality and ranked it as 7th worst air quality in the nation according to the association’s state of the air. Allegheny County is also home to two of the most polluted rivers in our country: the Monongahela and the Ohio. Over a century of industrial activity and coal mining have impaired the water but most recently sewer overflows from the city of Pittsburgh have sent dangerous levels of raw sewage into the surrounding waterways.

The population density combined with the very poor air and water quality could be the explanation for the anomaly. Furthermore, Allegheny County is also where our Pittsburgh office is located, which is perhaps the reason that we see so many cases in this region and not in other regions of high population density such as Philadelphia, Harrisburg, or Scranton.

When we started this project, we thought we would discover a correlation between intakes and regions with the heaviest environmental burdens. This could allow us to allocate our limited resources to those regions most efficiently. Unfortunately, the problem is not so simple.

As evidenced by the intake map, resource extraction in Ohio and Pennsylvania is spread over a very large area. That is troubling because the bigger the problem geographically the harder it becomes to deal with. We need to devote far more resources to protecting individuals who face spills, emissions, erosion, impacts to wetland, etc. By speaking more openly about how pervasive these environmental risks are, and how that risk plays into the bigger picture of the climate emergency, we hope we can incite folks to give their time, effort, and resources to defending their health and environment.


By Josh Eisenfeld, Marketing Director at Fair Shake Environmental Legal Services

Support this work

`

DONATE

Stay in the know

Ohio Secret Fracking Chemicals Report

Ohio’s Secret Fracking Chemicals