
Rising Incidents, Lax Oversight: Ohio Oil and Gas Incidents, Inspections, and Enforcement 2015–2025
Rising Incidents, Lax Oversight
Ohio Oil and Gas Incidents, Inspections, and Enforcement, 2015–2025

 Download the full report
Overview
Ohio’s oil and gas incident records document spills, leaks, equipment failures, and other potentially harmful events.1 These incident reports should help the public understand where these incidents occur, the risks to safety, health, and the environment, and how regulators and operators respond. But FracTracker Alliance’s analysis of Ohio Department of Natural Resources records from 2015 through 2025 found that, even as ODNR has improved some aspects of its data collection, major gaps remain. Incident classifications are often unclear, key details are buried in narrative descriptions, and records do not consistently show whether an event led to inspection, cleanup, enforcement, or corrective action. These gaps are particularly notable amid growing problems with oil and gas wastewater disposal, including releases and oil and gas wastewater migration associated with injection wells. However, one thing is clear: incidents are increasing in frequency on an annual basis. Without an understanding of the severity and complexity of these increasing oil and gas incidents, the public and policymakers may be lulled into a false sense of complacency and may be less likely to address serious problems until they threaten to become a crisis.
Key Findings
- 2,529 oil and gas incidents were recorded in Ohio from 2015 through 2025.
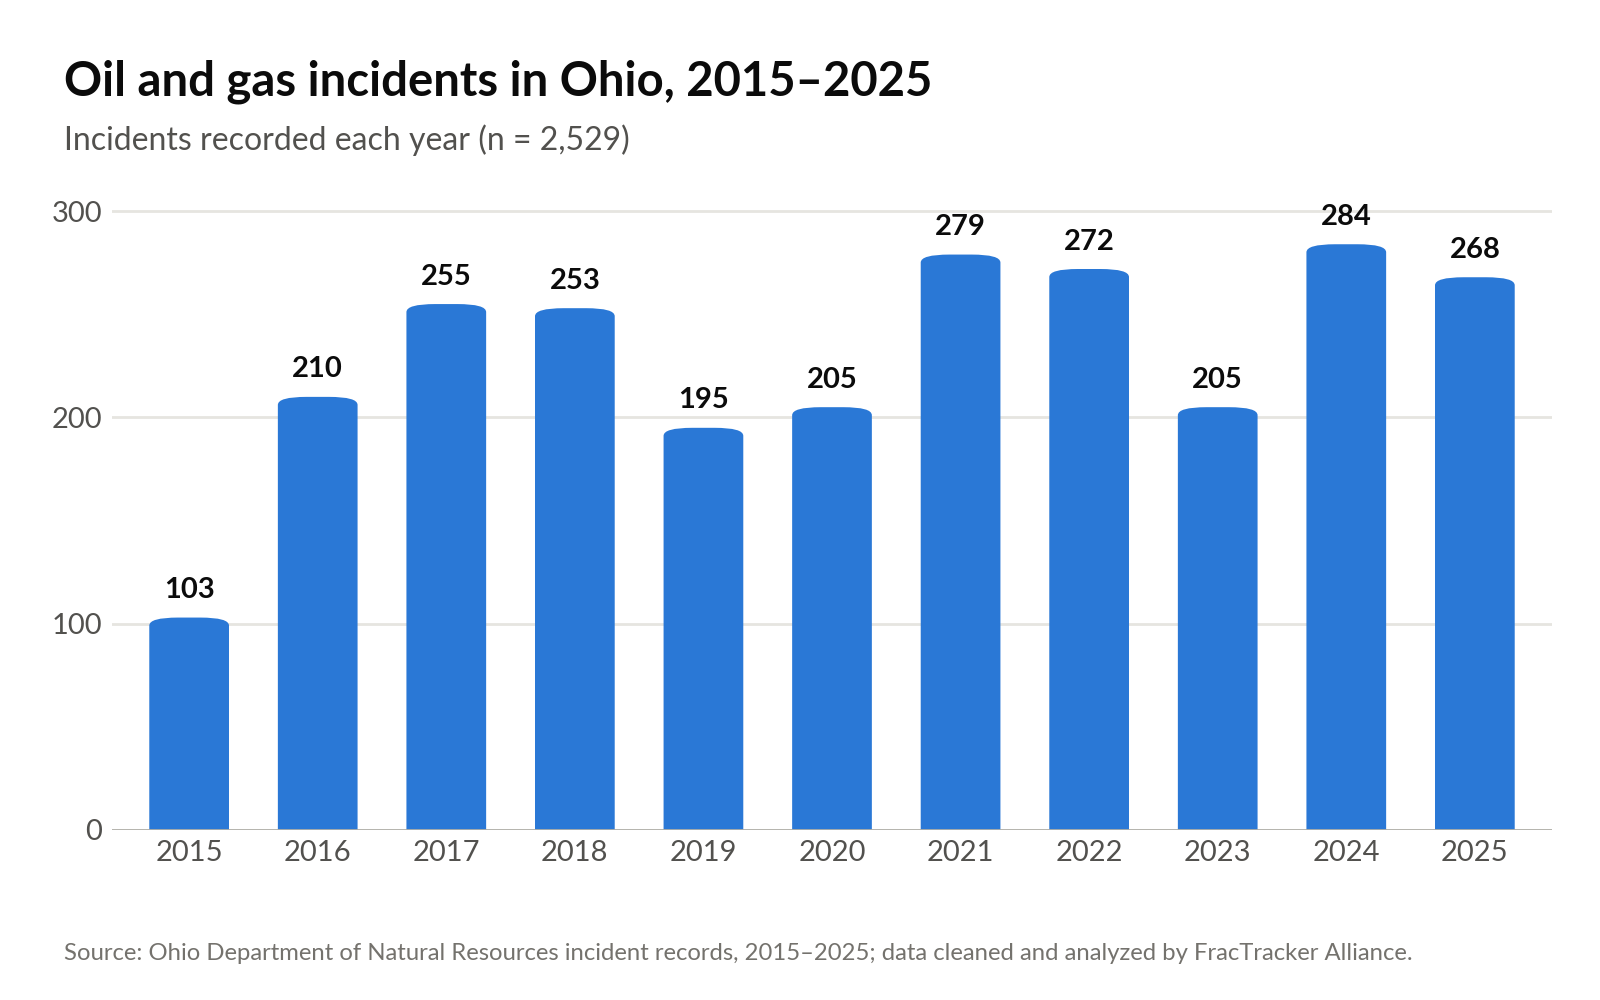
- Incidents are generally increasing, rising from 103 in 2015 to 268 in 2025, despite year-to-year variation.
- Persistent problems with poor incident classification and fragmented descriptions make it difficult to determine what happened, the severity of the incident, and how it was resolved.
- Our analysis shows that there is a lack of consistency in inspections, enforcement, and follow-up on the part of ODNR when wells have incidents or violations.
- ODNR’s inspection capacity appears insufficient for consistent and meaningful oversight. Roughly 25 inspectors are responsible for Ohio’s 96,000 wells.
Our Previous Analysis
This analysis builds on FracTracker’s 2024-2025 series, Data Gaps: A Critical Examination of Oil and Gas Well Incidents in Ohio. That work began after the president of the Ohio Oil and Gas Association stated publicly in 2023 that Ohio had experienced only one or two oil and gas incidents affecting environmental health and public safety during the previous decade. The statement prompted longtime Ohio activist and founder of the Daily Accident Report, Jenny Morgan, to request incident records from the Ohio Department of Natural Resources (ODNR) Division of Oil and Gas Resource Management (DOGRM).
The records2 told a very different story. After combining and cleaning ODNR’s annual spreadsheets, FracTracker identified approximately 2,000 incidents from 2015 through 2023. The analysis also found substantial problems with the data itself. Location information was frequently missing or inaccurate, incident classifications often failed to reflect the full nature of an event, and important details were buried in narrative descriptions. Roughly 100 records could not be included in the original map and analysis because their location information was too incomplete. Activist Jenny Morgan continued to dig into this important issue by creating the “Daily Accident Report,” a project documenting Jenny’s deep dives into specific incidents.
This updated analysis extends the dataset through 2025 and examines not only how incidents are recorded, but what the records show about the response that follows. ODNR has improved some aspects of its data collection, including location information, event types, and general consistency. But the expanded dataset exposes persistent problems with incident classification and raises broader questions about inspections, remediation, enforcement, and operator accountability. In many cases, the records still do not provide a clear path from the initial report of an incident to its eventual resolution.
What the Data Now Shows
Map of Ohio oil and gas incidents, 2015-2025. Open the full-screen map.
Number and Types of Incidents
One of the most notable trends in the data is an increase in incidents over the years of analysis. Since 2015, the number of incidents has generally gone up (Figure 1). Given the number of toxic substances associated with oil and gas wells, these incidents create the potential for communities and environments alike to be harmed.
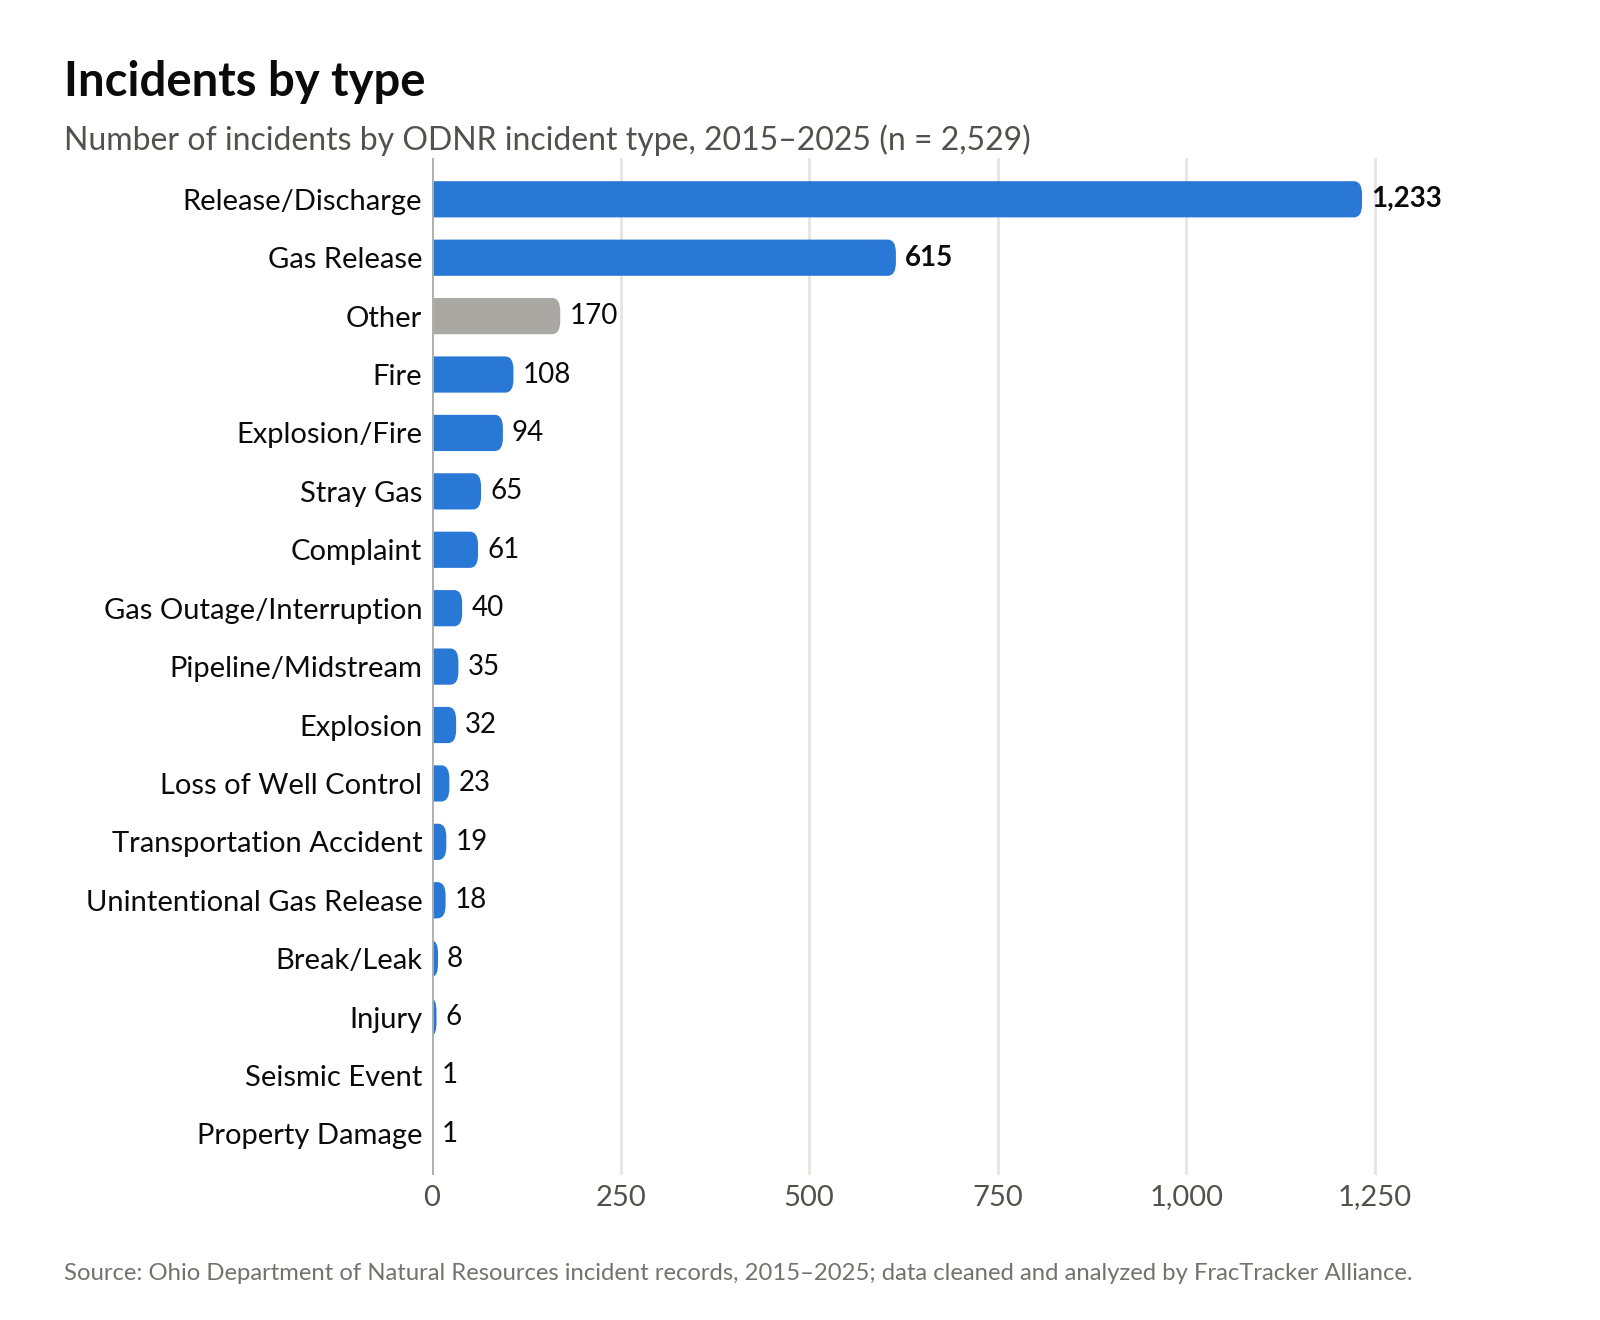
Consistent with our original analysis, the majority of incidents remain as unspecified releases and discharges (Figure 2), followed by gas releases. Some examples of such incidents include:
| ODNR incident record | No. 2017025 | |
|---|---|---|
| CountyMonroe County | Incident typeRelease/Discharge | ODNR classificationMajorLevel 2 of 5 |
| DiscoveredJan 29, 2017 | ClosedFeb 16, 2017 | Days open18 |
| OperatorJohn Burkhart Unregistered well | Product releasedOil (Crude) | Quantity reported40 BBLS |
| SummaryA release/discharge in Monroe County where a “property owner drained tank into Clear Fork Little Muskingum River on 1/28/17,” releasing 40 barrels of crude oil onto the land, constituting a “major” event classification. | ||
| ODNR incident record | No. 2025080 | |
|---|---|---|
| CountyCarroll County | Incident typeRelease/Discharge | ODNR classificationMinorLevel 4 of 5 |
| DiscoveredMar 29, 2025 | Closed— | Days openStill open |
| OperatorOWS Acquisitions Co LLC | Product releasedOil, Refined Sheen on Water FRQ | Quantity reported900 |
| SummaryA “minor” release of 1,000 gallons of crude oil mischaracterized in the data as water. Wyatt #1, operated by OWS Acquisition, released crude oil into a ditch which then entered an unnamed tributary to Sandy Creek. OWS attempted to remediate the release by removing the crude oil and contaminated soil. This remediation and a subsequent repair of the well were allowed to occur while parts of production resumed, despite the noted impact to land and water in Carroll County. | ||
| ODNR incident record | No. 201500102 | |
|---|---|---|
| CountyJefferson County | Incident typeGas Release | ODNR classificationModerateLevel 3 of 5 |
| DiscoveredOct 28, 2015 | ClosedNov 16, 2015 | Days open19 |
| OperatorHistoric Well | Product releasedNatural Gas | Quantity reportedUnable to estimate |
| SummaryDespite being categorized as a moderate gas release, this incident is described as “Report of gas odor” with no estimation of how much gas was released in Jefferson County. | ||
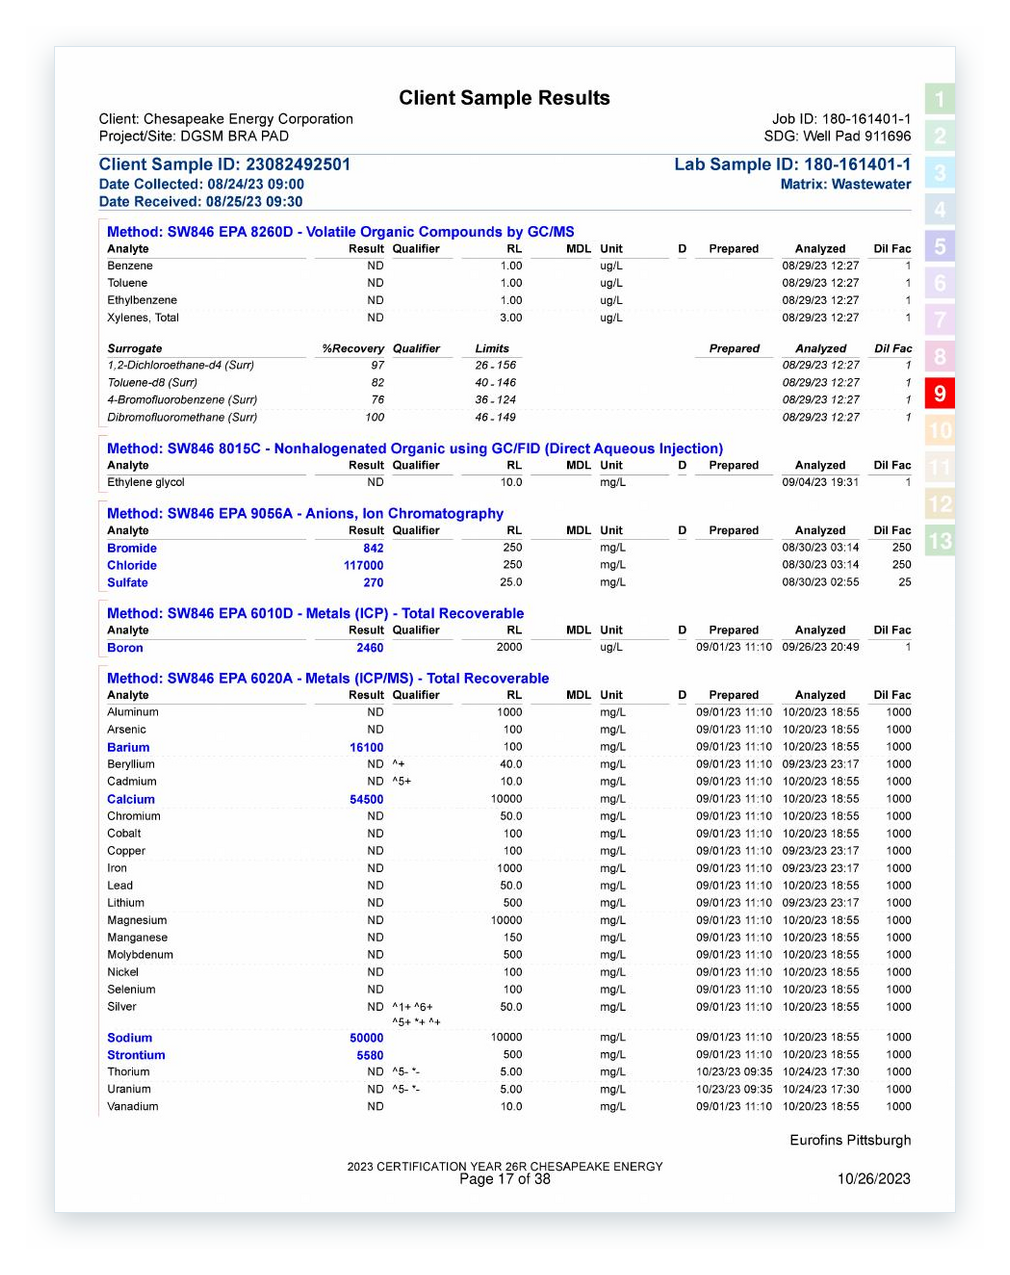
Because of the dispersed, short-lived, and difficult-to-capture nature of gas releases, incidents involving the discharge of gas go unquantified in the data reporting, leaving little clarity about the volumes of gas released. Under Ohio’s incident-reporting requirements, a release of any amount of gas is reportable when it results from a blowout, an uncontrolled pop-off valve in an urban area, or otherwise threatens public safety. Authorized controlled flaring and certain other controlled releases are excluded from these reporting requirements. Liquid releases are more likely to have estimated volumes in reports, but those estimates are still often incomplete. Among the 2,373 records in which the “estimated quantity” field was populated, 797 records listed the quantity as “unknown” or “unable to quantify. Other records only provided poor estimates like “>32 barrels”. In addition, some records show a discrepancy between the amount released reported in the “estimated quantity released” field and the “brief description” field, suggesting that the reporting of incidents could still be improved. It is difficult to estimate how many of these records with discrepancies exist due to the sheer number of records. It is important for ODNR to improve reporting systems in order for the public to understand the full extent of these releases because oil and gas-related fluids, particularly oil and gas wastewater,3 could contain toxic PFAS and high levels of radioactivity.
Authorized Activity and Classification of Incidents
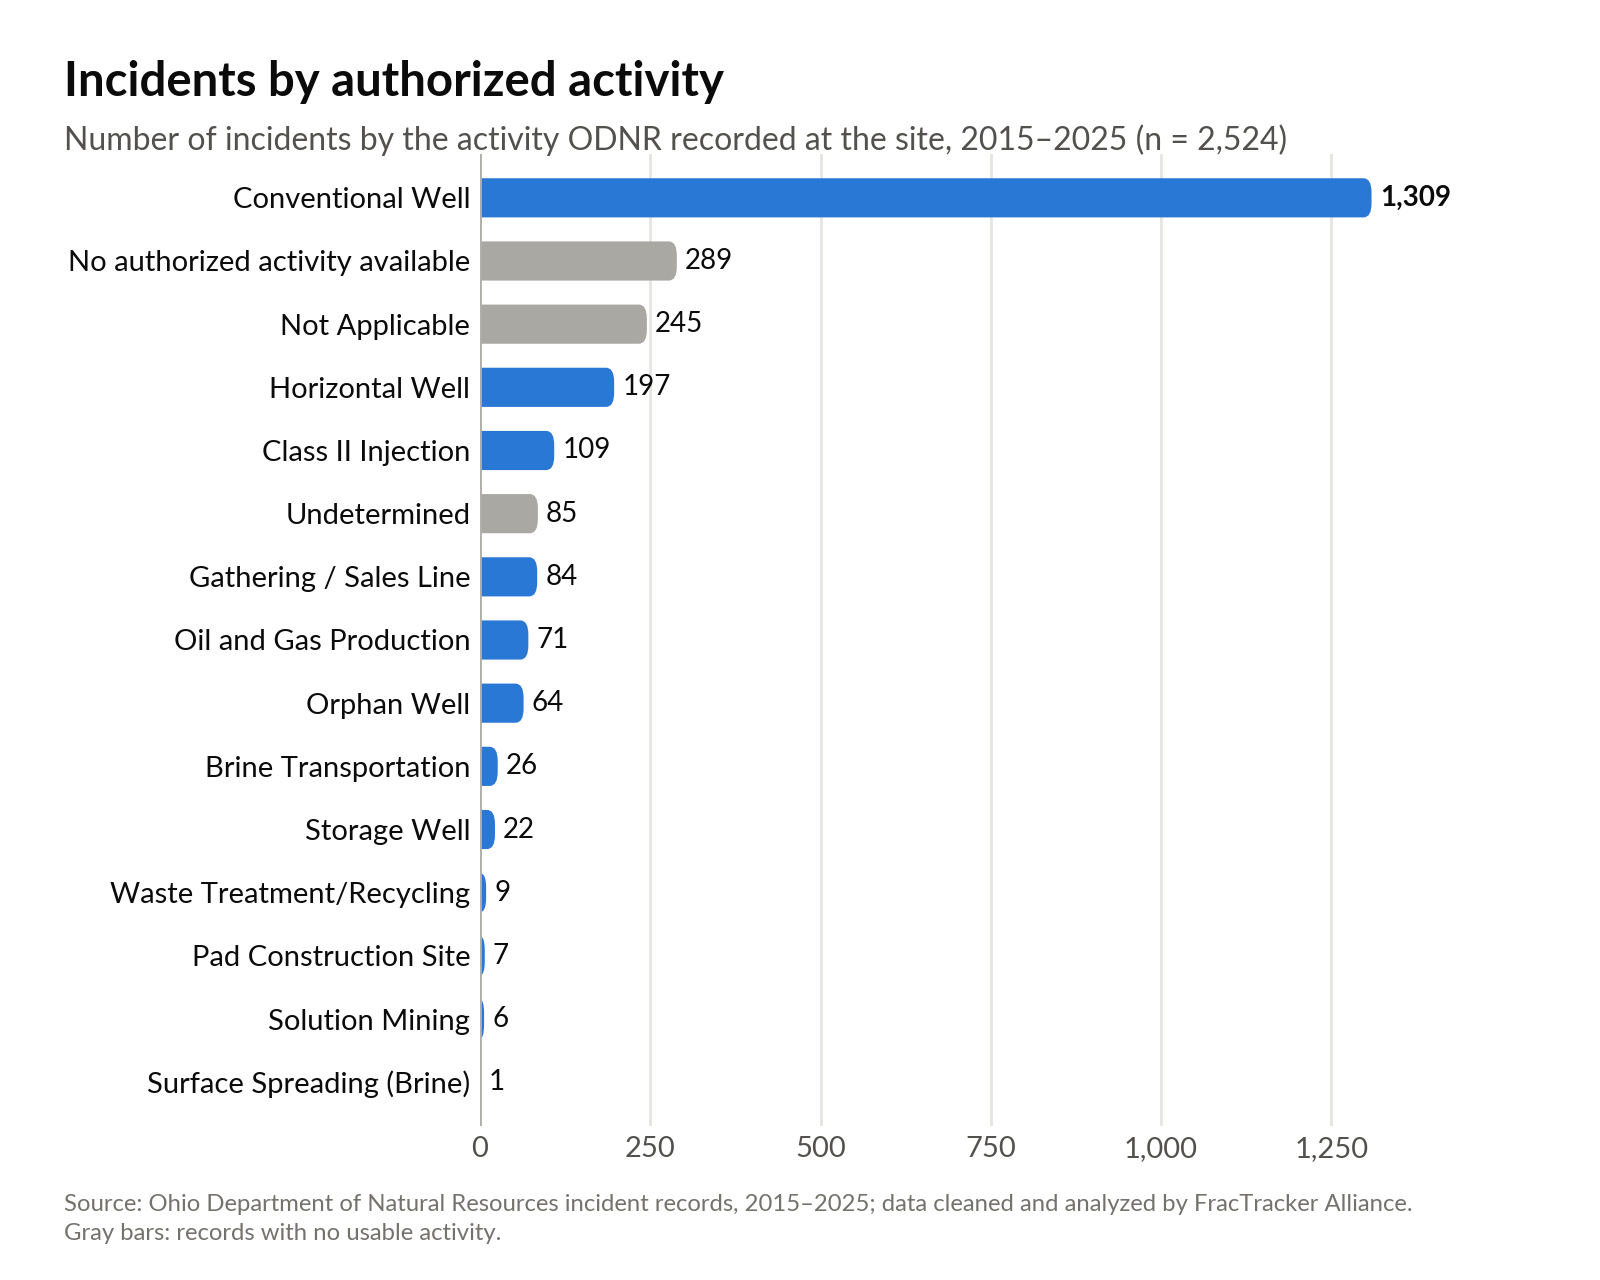
A large majority of incidents occur at “conventional” wells (Figure 3), a label that is likely to lead to confusion due to the lack of a definition of the word “conventional” in Ohio’s Oil and Gas code, and competing definitions in other prominent sources. In contrast, Ohio’s code defines a horizontal well as one drilled for oil or gas production in which the wellbore reaches a horizontal or near-horizontal position in the Point Pleasant, Utica, or Marcellus formation and the well is stimulated. “Stimulated” often means that the well has been hydraulically fractured. Hydraulic fracturing, or fracking, is a well-stimulation process in which fluid is injected under pressure to fracture underground rock formations. “Horizontal,” “directional,” and “near horizontal,” describe the path of the wellbore. Horizontal drilling and hydraulic fracturing are commonly used together in shale development, and such wells are commonly called “unconventional.”
Taken together, this terminology might suggest that “conventional” wells are any wells that are not “unconventional” or any wells that do not combine horizontal drilling and hydraulic fracturing. However, Ohio’s Oil and Gas code does not make this distinction. The United States Environmental Protection Agency (U.S. EPA), in its 2016 report on fracking and drinking water defined the difference between conventional and unconventional as related to the type of formation rather than to the type of technology used to extract oil or gas. “Conventional oil- and gas-bearing rock formations,” U.S.EPA wrote, “are often described as ‘permeable’ and tend to have many large, well-connected pore spaces that allow fluids to move within the rock formation. Unconventional oil- and gas-bearing rock formations do not exhibit these characteristics.” The U.S. EPA made clear that both conventional and unconventional wells could be fractured and that, in recent years, there had been increased production of oil and gas from unconventional formations (see page 1-3, including footnote 1, and page 3-1). Similarly, one of the world’s leading hydraulic fracturing companies, Schlumberger, notes in its Energy Glossary that the definition of “unconventional” has changed over time, but “[a]t present, the term is used in reference to oil and gas resources whose porosity, permeability, fluid trapping mechanism, or other characteristics differ from conventional sandstone and carbonate reservoirs. Coalbed methane, gas hydrates, shale gas, fractured reservoirs, and tight gas sands are considered unconventional resources.” Like U.S. EPA’s definition, Schlumberger’s characterization focuses on the nature of the formation, not the method of extraction.
On the other hand, the U.S. Energy Information Administration (EIA) defines the difference between “conventional” and “unconventional” in part based on the technology used to produce oil and gas. “Conventional production generally means that crude oil and natural gas flow to and up a well under the natural pressure of the earth,” the EIA wrote. “Unconventional production requires techniques and technologies to increase or enable oil and natural gas production beyond what might occur using conventional production techniques.” Because Ohio law does not define “conventional,” it is unclear whether ODNR is applying any of the three definitions listed above or defines “conventional” and “unconventional” in a different way.
Conventional Does Not Equal Safer
As a result, ODNR’s use of the term “conventional well” in this dataset should not be read as a precise description of a well’s age, orientation, depth, or stimulation history. Some wells categorized as conventional may be vertical and older, and some may also have been hydraulically fractured, but are still distinct from horizontal wells. The “well phase” column within the data indicates that some incidents occurring on conventional wells happened during “completion/stimulation,” suggesting that conventional wells in this dataset may reference fracking activities. The dataset also includes “oil and gas production” as one of the categories of activity, or “authorized activity” as it is called in the data. It is unclear how that category differs from the conventional and horizontal well categories or whether it includes incidents associated with well stimulation. ODNR used the category from 2016 through 2022, but it does not appear in the more recent records.
Labeling oil and gas wells as “conventional,” without defining the term, may lead some people to inaccurately assume that incidents at these wells pose less of a risk to the public. This assumption may stem, in part, from the fact that most oil and gas production in Ohio and the U.S. now comes from unconventional wells, using the definitions listed above. And it is these unconventional operations that have received most of the attention in recent years regarding pollution impacts. But because Ohio does not define “conventional,” the label does not indicate whether an incident associated with it poses less risk.
A separate regulatory distinction may reinforce the perception of the relative safety of “conventional” wells. In 2016, U.S. EPA issued a rule prohibiting water from onshore unconventional oil and gas wells from being disposed of in Publicly Owned Treatment Works (POTWs). POTWs typically collect wastewater from homes and businesses and send it to sewage treatment plants. U.S. EPA defined unconventional oil and gas resources as “crude oil and natural gas produced by a well drilled into a shale and/or tight formation (including, but not limited to, shale gas, shale oil, tight gas, and tight oil).” Wastewater from conventional wells was not covered by the rule.
However, in U.S. EPA’s 2016 report on fracking and drinking water, the agency wrote that “[p]roduced water generated from unconventional reservoirs is reported to be similar to produced water from conventional reservoirs in terms of TDS [total dissolved solids], pH, alkalinity, oil and grease, TOC [total organic carbon], and other organics and inorganics.” Produced water, as U.S. EPA defined it in its 2016 report, is wastewater. Therefore, it is unclear whether wastewater from conventional wells is significantly different than wastewater from unconventional wells. And it is possible that incidents at either conventional or unconventional wells involving wastewater could pose pollution risks. These uncertainties and the lack of a definition for conventional wells in Ohio’s Oil and Gas code means that Ohioans should not assume that incidents at “conventional” wells are safer than those at other types of wells.
In addition to qualifying incidents by the authorized activity at a given incident site, ODNR also uses an incident classification matrix to categorize the severity of reported incidents (Figure 4). The matrix considers both the reported consequences of an incident and the agency’s assessment of whether the release or hazard is contained or under control. Because those judgments may be made before the full extent of an incident is known, the classification can reflect the initial perception of control and impact rather than the event’s ultimate severity. An incident may therefore be classified as minor when it appears to have been contained quickly or to have caused limited harm, while incidents perceived as uncontrolled or more consequential receive a higher classification.
| Classification | Incident criteria |
|---|---|
| Information Only Level 5 incident | Normal conditions. DOGRM involvement only. Controlled and stabilized in less than 4 hours. Follow-up by DOGRM within 24 to 48 hours. Little to no resource needs. Does not exceed reportable quantities with nominal public safety or environmental impact. |
| Minor Level 4 incident | Normal conditions. May/may not involve other agencies. Controlled and stabilized in less than 4 hours. Limited deployment within 2 hours. Little to no resource needs. Exceeds reportable quantities with minimal public safety or environmental impact. |
| Moderate Level 3 incident | Increased Readiness Conditions. One to three agencies involved due to regulatory authority. Controlled and stabilized in less than 12 hours. Immediate deployment with extended operational phase(s). Additional resources needed. Exceed reportable quantities with considerable public safety or environmental impact. |
| Major Level 2 incident | Escalated Response Conditions. Multiple agency involvement and coordination. Uncontrolled impact will take 12 to 24 hours to contain hazard(s). Immediate deployment with extended operational phase(s). Additional resources needed. Exceeds reportable quantities with sizeable public safety or environmental impact. |
| Severe Level 1 incident | Emergency Response Conditions. Multiple agency involvement and coordination. Uncontrolled impact will take 24 hours or more to contain hazard(s). Immediate deployment with extended operational phase(s). Additional resources needed. Exceeds reportable quantities with significant public safety or environmental impact. |
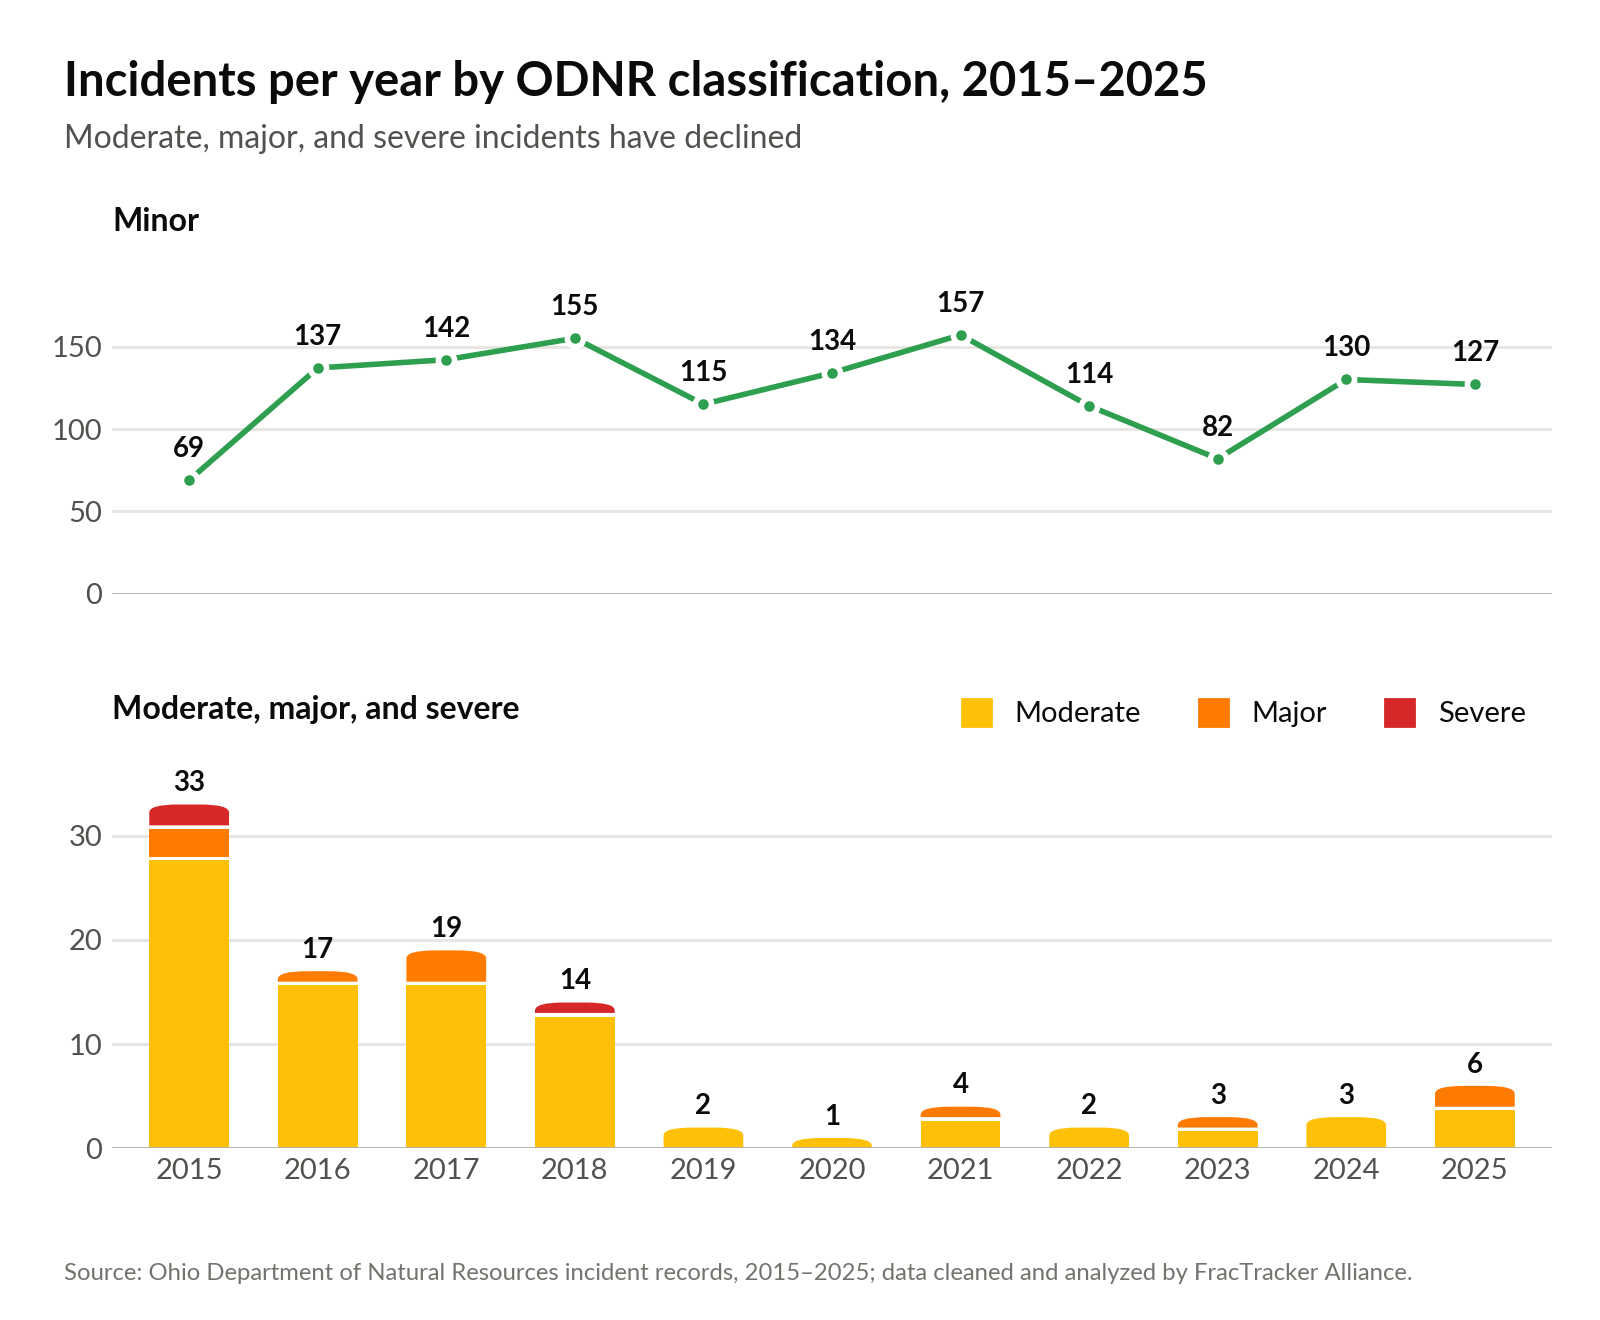
Moderate, major, and severe incidents have seemingly decreased over time (Figure 5), but descriptions of minor incidents are not convincing as “minor”. Incident 201600072, which occurred in 2016, was classified as minor and described as “Static electricity from overhead power lines caused a conventional well’s tank to explode.” The explosion of the EnerVest-operated tank released 59 barrels4 (2,478 gallons) of crude oil and 5 barrels (210 gallons) of oil and gas wastewater. Because this event was classified as minor, it may indicate that there were few impacts to the environment, or that the incident was contained quickly. However, the records indicate this incident was open for four days, leading to questions about the accuracy of the classification. It is unclear if the incident was “open” due to prolonged discharge or if remediation and follow-up took multiple days, but more information is needed to determine if “minor” was an appropriate classification.
As concerning as the incident classification itself is, prior to the incident, the well had not been inspected for 12 years according to Ohio’s Oil and Gas Database, also referred to as RBDMS. After the explosion in 2016, the well was inspected in 2017, 2019, and twice in 2024, suggesting that inspections may increase after incidents, but are generally inconsistent. None of the following inspections made mention of the explosion. Records also indicate that in 2020, EnerVest sold the associated well to OWS Acquisitions, but this change in ownership did not prompt any additional inspections. While Ohio law does not appear to mandate inspections upon every ownership transfer, the absence of one was notable given the well’s incident history.
| ODNR incident record | No. 201600072 | |
|---|---|---|
| CountyColumbiana County | Incident typeExplosion | ODNR classificationMinorLevel 4 of 5 |
| DiscoveredApr 22, 2016 | ClosedApr 27, 2016 | Days open4 |
| OperatorEnerVest Operating LLC | Product releasedOil (Crude) | Quantity reported59 bbl, 5bbls brine |
Incident 201600072 is not the only example of potential mischaracterizations of well incidents. Another “minor” incident is incident 2025018, which involved an unknown quantity of oil and gas wastewater released from a well while it was being plugged through an orphan well program. ODNR’s records state that the well had been “flowing overnight with no well control in place” and was located in a 100-year floodplain. Both the duration of the release and potential scale suggest this incident’s severity was misclassified by the agency’s own criteria, especially considering that in the “Estimated Quantity Released” field, the volume listed was “Brine >42 US Gal. in 24 hrs,” a reportable quantity if the oil and gas wastewater was released into the environment. Conflicting information within the data (e.g., both the note of an “unknown quantity” and “Brine >42 US Gal. in 24 hrs” within the same incident record) makes it difficult to understand how much was actually released and if the incident should be considered “minor”. Inspection reports show that after this incident, the well was not inspected until 9 months later, when the orphaned well restoration was complete, meaning the amount of oil and gas wastewater released may still be unknown. These two examples above are not outliers; other records in incident data follow similarly concerning patterns of mischaracterization.
Events by County
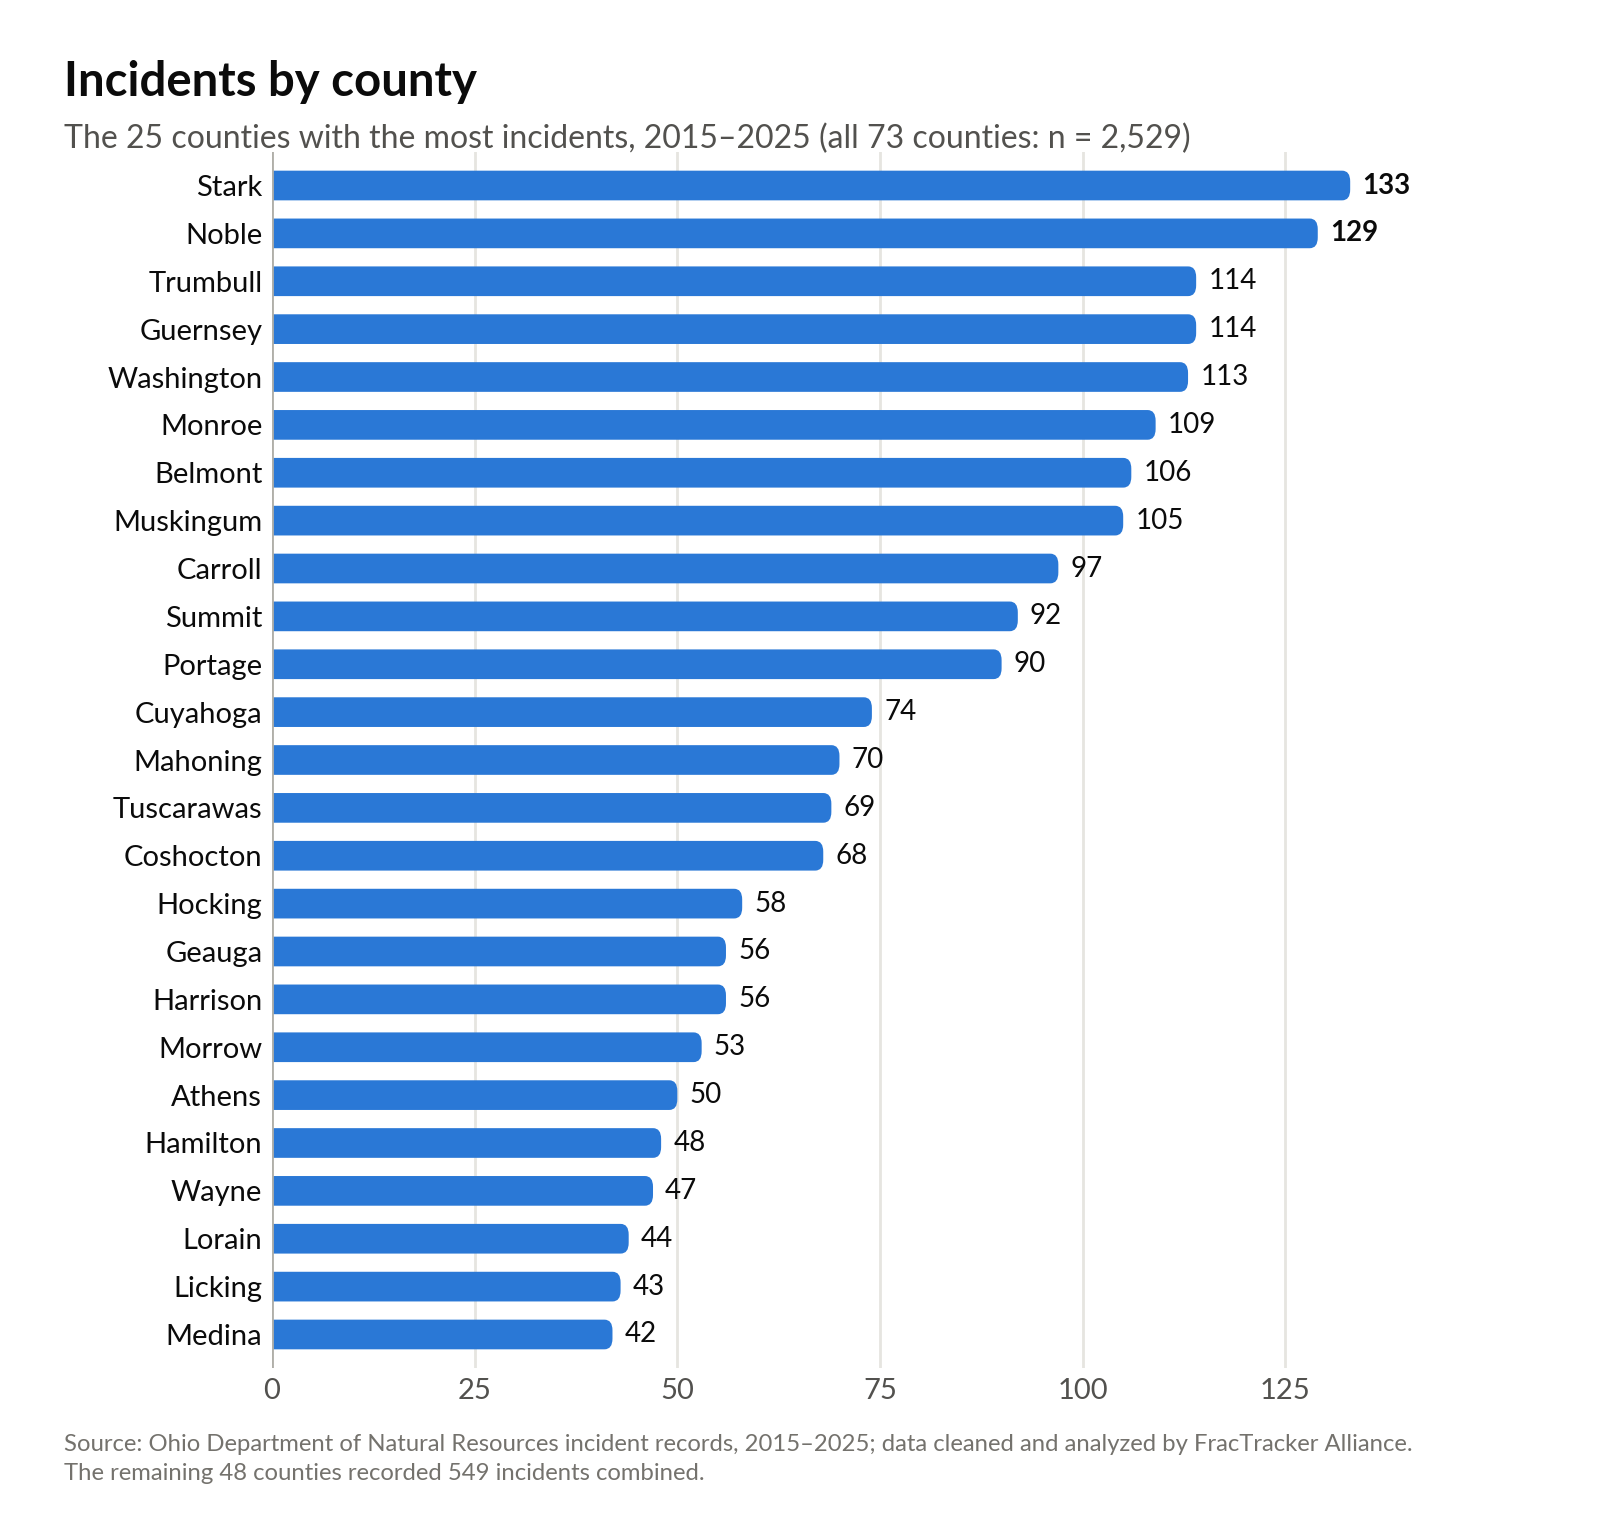
Given the pattern of mischaracterized incidents, it’s worth examining where incidents are concentrated. Stark and Noble counties have the highest counts of incidents, with each county recording about 130 incidents (Figure 6). These counties both have a moderately high number of wells, but according to FracTracker records, they do not have the largest number of total wells. Incidents in these two counties follow the general trend of the data; releases at conventional wells dominate the incidents within these counties.
Incident Durations
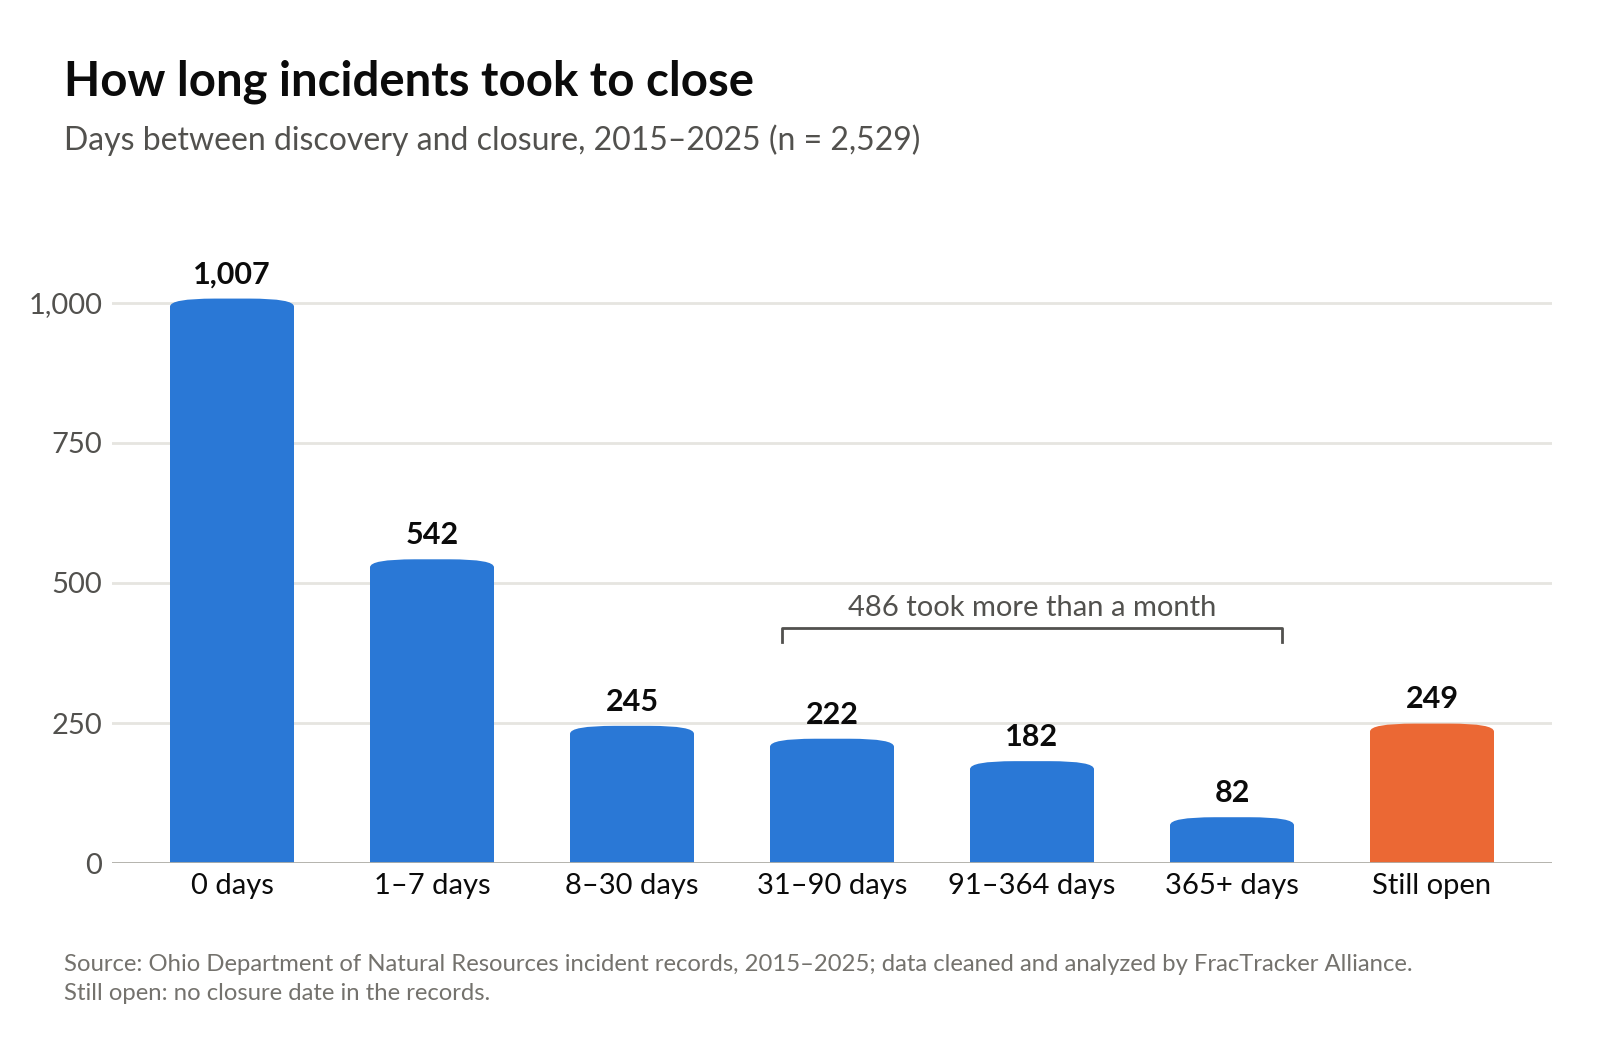
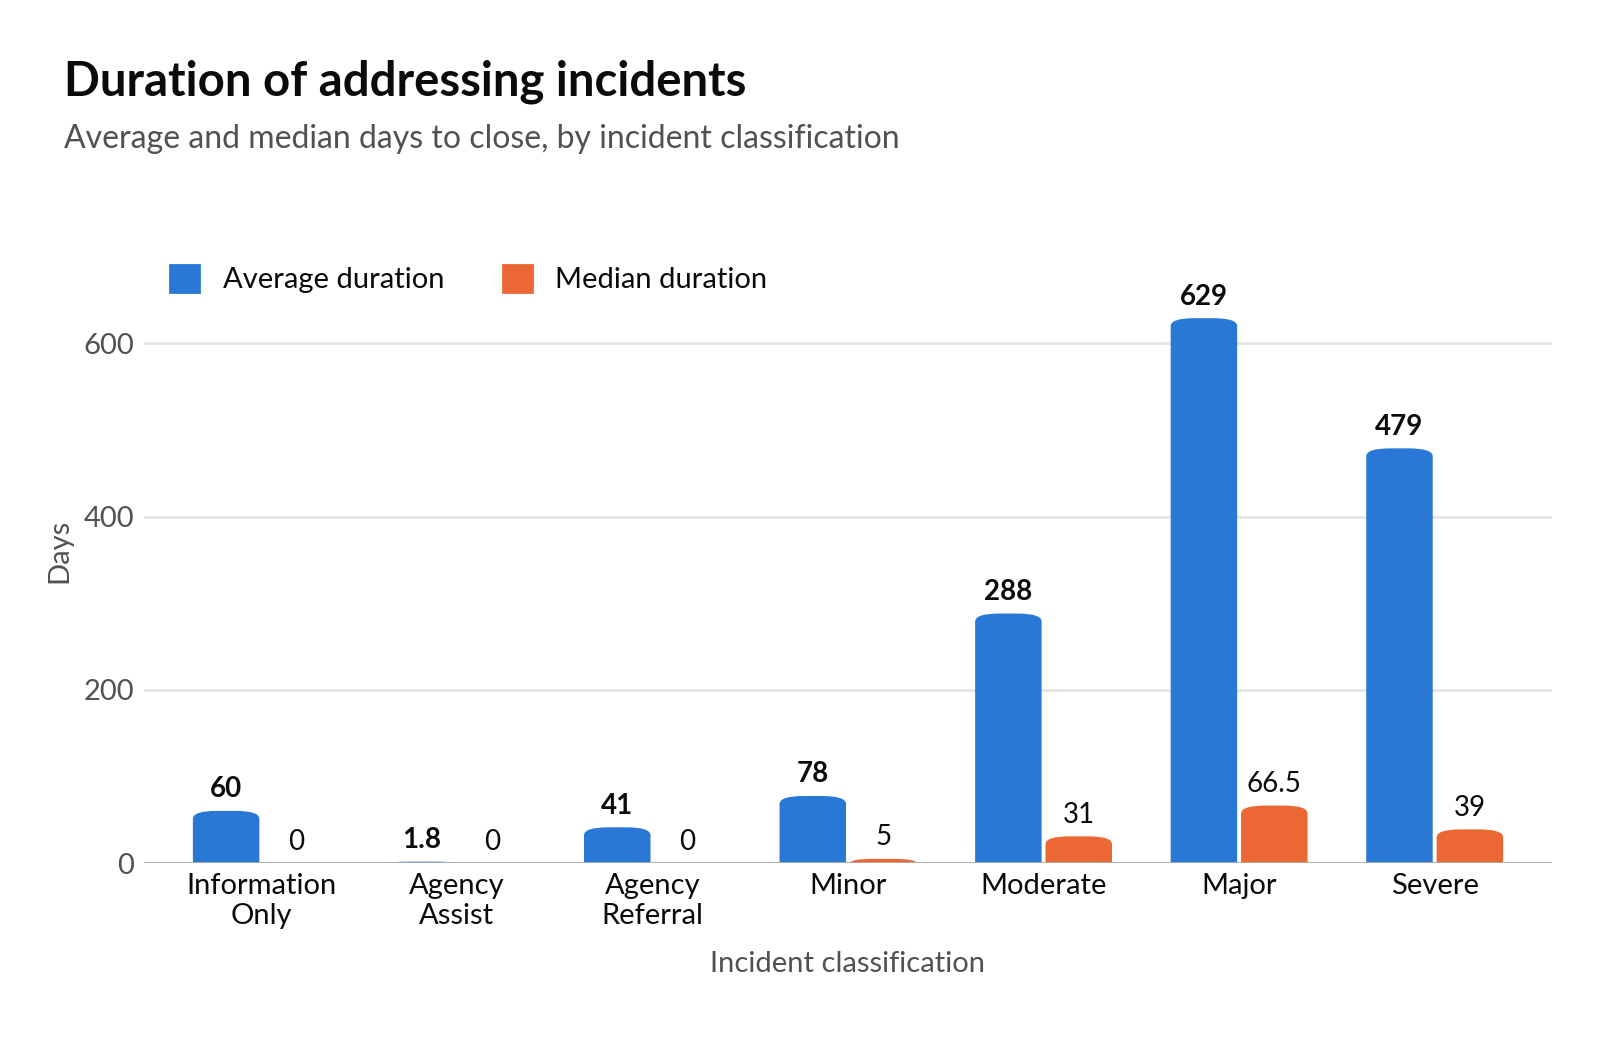
Incident durations may also be cause for concern. In this analysis, FracTracker Alliance defines “duration” as the time, in days, between incident discovery date and closure date as noted in the records. According to the records, many incidents were “closed” or addressed within the same day (Figure 7). Closure is not defined in the Ohio Administrative Code that dictates emergency response and tracking, but likely refers to completing any follow-up to an incident, like field response, remediation, documentation, or another administrative milestone. Many of the incidents that were addressed within a day were incidents classified as less severe, that is, those classified as “information only,” “agency assist,” “agency referral,” and “minor” (Figure 8). However, despite many less severe incidents being closed within the same day, 486 incidents took over a month to close, and 249 records from as far back as 2018 remain open, or without a closure date today. These open records could be a reflection of the time it takes to fully remediate sites, a gap in documentation and data entry, or the Oil and Gas Management Division’s lax philosophy on addressing violations, where the “Division seeks to return the regulated community to compliance at the lowest level of enforcement possible”. Public confidence in ODNR’s response would be improved by enforcement that is clearly commensurate with the severity of the incident.
As with the previous FracTracker analysis on the topic, the “Brief Description” field continues to be the most comprehensive attribute in understanding incidents. The field often describes equipment failure found during routine inspections and maintenance, as well as landowner notification of leaks, spills, and odors. The field also sometimes details the inspector’s actions, follow-up, or communication around an incident. The “Brief Description” field also highlights shortcomings in the dataset’s other categories. It more frequently quantifies volumes of products released than the other data columns, and gives additional context that reveals discrepancies in incident classification.
Oil and Gas Wastewater Disposal in Injection Wells, Transportation, and Road Spreading
How injection wells work
The waste is not stored in an empty subterranean tank or cavern; it enters the pore spaces of permeable rock within the injection zone. Injected fluids move through pore spaces in the receiving formation. If a well is improperly constructed or operated, if natural fractures already exist, if a high volume of injected fluids creates fractures, if improperly plugged wells are present, or if there is no porous and permeable reservoir, trapping mechanism, or impermeable seal to prevent fluid flow, fluids can migrate outside the permitted injection zone.
A note on terms. This report uses “oil and gas wastewater” to describe the combination of naturally occurring toxic saltwater and flowback and chemicals incorporated to that water during the fracking process. Oil and gas wastewater is sometimes referred to as “brine” or “produced water,” in different contexts. These are distinct terms with distinct meanings but are often utilized interchangeably.
Incident reports related to transportation, disposal, storage, and spreading of oil and gas wastewater also raise significant tracking and response issues. Oil and gas companies inject oil and gas wastewater into underground formations through wells classified as Class II under the Safe Drinking Water Act’s Underground Injection Control program. FracTracker and Buckeye Environmental Network have previously collaborated to map some of Ohio’s more concerning injection wells.
Spills, leaks, and other releases of oil and gas wastewater can cause significant damage to the environment. In 2018, in Pickaway County, documented in incident 2018188, a routine inspection found a “brine kill area and leak of brine occurring from a pin hole size leak.” Further inspection notes that over 1 bbl (42 gallons) of oil and gas wastewater was released from the pinhole leak, raising questions about how long the leak continued before detection. Similarly, another incident states, “UIC inspector arrived on site for routine inspection and observed three separate kill area (sic) around the surface brine storage facility indicating a release of brine. Containment dike had approximately 10″ of brine and some oil in it.”
Issues involving oil and gas wastewater were not just limited to under-addressed leaks. They were also characterized by descriptions of oil and gas wastewater hauler accidents and potential unreported accidents. Examples include incident 2018220, which states “Tanker accident caused 20bbl of production brine released into a creek. OEPA DNR Wildlife informed. There was no recovery due to fast waters.” and incident 2018187, described as “Former employee reported underreporting of releases to the OneCall alleged release(s) have occurred in containment.” Numerous oil and gas wastewater truck rollovers and releases are described in the data, bringing up questions around the safety of transportation of oil and gas wastewater. Nine incidents directly reference “brine kill” or an area of vegetation that is or has been dying due to oil and gas wastewater releases to that area. The fact that such a phrase is well-documented in the records indicates the seriousness with which incidents involving oil and gas wastewater should be considered.
| ODNR incident record | No. 2021011 | |
|---|---|---|
| CountyWashington County | Incident typeRelease/Discharge | ODNR classificationMinorLevel 4 of 5 |
| DiscoveredJan 20, 2021 | ClosedApr 2, 2021 | Days open72 |
| OperatorDeeprock Disposal Solutions LLC | Product releasedBrine >42 US Gal. in 24 hrs | Quantity reported23 Barrels |
Despite improvements in data collection, such as consistent field usage and better organization since our previous report, it continues to be difficult to properly evaluate the data. Incident 2021011 describes an issue with the Heinrich Unit #2 well owned by DeepRock Disposal Solutions LLC. The incident was described as “Visited site to determine if incident can be closed out. Operator hauled out the contaminated soil and filled in all the trenches. They also put down seed and straw.” There is no description of the incident that created the contaminated soil. It is unclear if this incident’s original description has been overwritten, and no other record in the incident data is attributed to this well’s name or API number, a unique numeric identifier assigned to each oil and gas well.
The only other incident associated with DeepRock within the incident data is incident 2024282, which could have created contaminated soil but is attributed to a different well. The description reads as follows:
| ODNR incident record | No. 2024282 | |
|---|---|---|
| CountyWashington County | Incident typeRelease/Discharge | ODNR classificationMinorLevel 4 of 5 |
| DiscoveredDec 22, 2024 | Closed— | Days openStill open |
| OperatorDeeprock Disposal Solutions LLC | Product releasedBrine >42 US Gal. in 24 hrs | Quantity reportedunk |
| ODNR brief description (as recorded)“Dave Casto (DeepRock) reported a brine release occurred at their site on December 22. 2024 at approximately 5:00PM. The brine release is reported to have consisted of between five and eight barrels that resulted from a defect in a check valve on the wellhead of the well named Helen F Hall (SWIW #7) 1-19. A portion of the brine was released outside of secondary containment and impacted land and a nearby intermittent drainage. Deeprock utilized absorbent material in an attempt to prevent migration of brine further into the environment on the evening of December 22, 2024. UIC Inspector Kyle Newbrough was notified of the release and visited on December 23, 2024. On site, Inspector Newbrough worked with Deeprock to construct containment and remediation measures. EOR Coordinator Nathan Lane visited the site to ensure the release was stabilized, leading edge controlled, and remediation is underway.” | ||
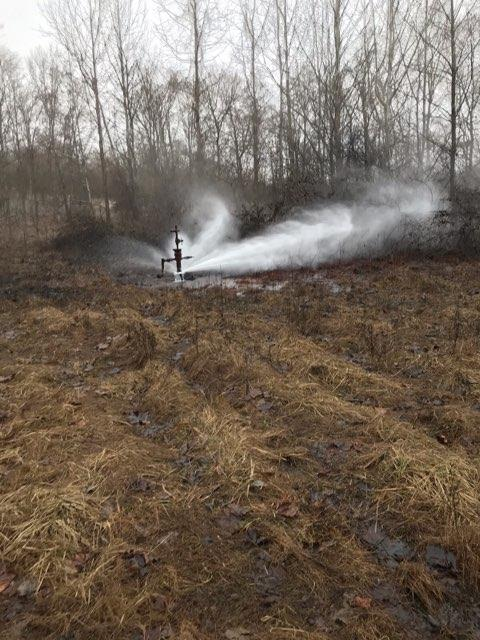
Another incident involved DeepRock but was not associated with DeepRock in the incident data. In incident 2021015, oil and gas wastewater shot from a production well at 42 gallons a minute (Figure 9) in Noble County in 2021. The source of the oil and gas wastewater was nearby wells where DeepRock was injecting oil and gas wastewater, according to a later Chief’s Order by ODNR. However, the incident data assigns the incident to the well at which the blowout occurred, named Ohio Power Gant #17-69, operated by Genesis Resources LLC.
This assignment of the incident to Genesis Resources LLC, rather than DeepRock, is not just a difficulty for those exploring the data. While it is reasonable to tag the location of this incident as occurring at the Ohio Power Gant #17-69 well, initially attributing the cause of the incident solely to the operator Genesis Resources may not only make searching for more information on a highly publicized incident difficult, but also may have implications for ensuring proper enforcement and mitigation related to the incident. Prior to the incident, ODNR had ordered Ohio Power Gant #17-69 to be plugged, but Genesis Resources had not done so. DeepRock’s injection wells were suspended, but the state held Genesis Resources responsible for the cost of remediation, an issue that is now the subject of a lawsuit from Genesis Resources’ insurance agency. Additionally, since its suspension, DeepRock has been fighting to reopen the wells and has most recently appealed the Chief’s Order to remain shut down to the Ohio Oil and Gas Commission. Concerningly, the seat of this commission that represents the public is vacant during this appeals process.
Enforcement
The records indicate a few channels through which regulators discover, or are notified of, incidents. Sometimes, inspectors identify incidents during routine inspections. Incidents have also been called in by well operators or emergency services near a given well. Many records indicate that landowners, not well operators, are the ones spotting leaks and flagging when remediation efforts were not completed successfully. Additionally, some incidents are reported through Ohio EPA’s emergency response program. Although Ohio EPA (OEPA) is not the primary regulator of the oil and gas industry, they do assist ODNR when pollutants leave a given well pad, enter waterways, or threaten public drinking water. This shared response can make it difficult to determine responsibility for the follow-up and long-term inter-agency oversight regarding incidents. OEPA notes that a significant portion of the incidents they respond to deal with releases of petroleum products. They also note that the responsible party for many incidents is the operator itself, who is also often responsible for the cost of clean-up. With only around 25 oil and gas inspectors in ODNR and roughly 15 coordinators for Ohio EPA’s Emergency Response program, efforts by the state regulatory agencies to prevent and remediate incidents may be limited in nature by logistical factors such as caseload and time spent with a given case.
An analysis conducted by FracTracker for this report found that the 25 inspectors at ODNR are responsible for roughly 96,000 active wells, not including wells that are plugged or abandoned. Using Ohio’s RBDMS system, FracTracker was able to access the duration of inspections and average the amount of time inspectors have spent on inspections in recent years. Reviewing only current inspectors leads us to conclude that it would require, on average, roughly 664 work days per inspector to review all the active wells in the state. This means that it would take inspectors in the state over two-and-a-half work years to return to a given well. While this average is helpful for understanding that ODNR inspectors are overall overburdened, some inspectors are especially overburdened. For example, one inspector is responsible for roughly 1,500 wells, all contained within Harrison County. Another inspector is responsible for all wells in 26 counties, which total around 24,000 wells. This roughly estimated inspector burden does not take into account the responsibility of ODNR inspectors to examine and regulate more inactive well types.
Unrealistic inspector workloads have practical consequences for how frequently wells are inspected and how problems are identified. Buckeye Environmental Network has documented many instances in which an inspection was both necessary and not completed. One such example is that of the Kris-Mar 1 oil and gas production well located in Washington County, in Marietta, Ohio. In 2019 and 2020, oil and gas wastewater was suspected to have migrated from a neighboring wastewater injection well and bubbled out of conventional production wells near Kris-Mar 1. Although ODNR had been notified of issues with neighboring production wells, it did not inspect Kris-Mar 1 until 2021, at which point the well had not been in production since 2018. The 2021 inspection cited a violation for failure to post notification, which is the required signage identifying the well name, operator, and emergency contact information, and gave the operator 10 days to remedy it. Nearly a year passed before the next inspection, which found the same posting violation still unresolved and noted “an old release in the area.” By the following inspection in 2023, the well was actively leaking and had destroyed surrounding vegetation, as documented in the inspection reports and in incident 2023100. Each of these earlier visits had been spent revisiting the same unaddressed violation, a pattern that continued to shape ODNR’s response after the fact. What followed the leak was a years-long process of compliance notices and requests to remove contaminated soil, with inspections becoming more frequent but the well still struggling to reach full compliance long after the leak was first observed. This means that inspectors had to spend a significant amount of time attempting to bring this well into compliance, visiting the site a total of 20 times between May 2023 and October 2025. This incident record has not yet been closed. Perhaps at least some of the pollution and the time-consuming regulatory efforts could have been avoided had ODNR’s inspector been able to inspect Kris-Mar 1 sooner and more regularly.
An additional question as to why this well was leaking also remains. Wells in this area have been suspected by oil and gas producers and advocates to be leaking due to nearby wastewater injection wells, including DeepRock’s American Growers #1 well, 1,120 feet away from the Kris-Mar 1 well. Cumulative subsurface pressure from injection wells receiving millions of gallons of oil and gas wastewater in Southeast Ohio is possibly resulting in migration of the waste fluids into these conventional wells, leading to increasing pressures at the conventional wells and releases into the environment, such as what has occurred at the Kris-Mar 1. At the time of writing this analysis, these suspicions were made more tangible after ODNR announced the voluntary cessation of operations for four injection wells in Washington County, Ohio. In recent years, disposal zones in Southeastern Ohio have produced “unprecedented migration of brine [wastewater],” according to ODNR. The ODNR should immediately investigate instances when there is suspected migration of oil and gas wastewater, rather than taking a “wait and see” approach.
Beyond the thousands of production wells in Ohio, ODNR has sited 232 active or permitted Class II Injection Wells throughout the state. A different set of four inspectors are responsible for the inspection of these wells. These inspectors not only have the major undertaking of being responsible for 50+ wastewater injection wells, but they also cover a vast geographical area. One inspector is reportedly responsible for counties including Holmes, Tuscarawas, Perry, and Washington, a non-contiguous area that spans over 2,000 square miles.
This high inspector burden, paired with the potential remediation costs or fines operators may incur for reporting incidents, means the onus of reporting is seemingly left to landowners and residents who may have oil and gas wells on and around their land. The option for citizens to report incidents they see is vital; citizen reporting means more eyes on the incidents and more trust between citizens and the regulators that serve them. However, the current reliance on citizen reporting undermines regulatory accountability, relieving operators of their fundamental obligation to ensure well safety.
ODNR’s website describes an escalatory approach for enforcement, ranging from informal to more formal measures, depending on the nature of violations. However, FracTracker separately requested records for “nonappealable Material and Substantial violations from 2000 to 2025,” that is, violations with formal enforceable action through Ohio’s oil and gas code. FracTracker Alliance undertook a small, separate analysis of these violation records since 20195, and found that very few violations have addressed incidents, spills, or pollution events. For example, the widely publicized 2021 DeepRock Disposal incident resulted in Chief’s Order 2023-02 suspending the wells of concern, but did not result in any additional fines, violations, or further enforcement action. As stated earlier in this report, DeepRock Disposal is currently attempting to reopen those injection wells that were problematic.
In a similar manner, a report conducted by Buckeye Environmental Network on the Redbird #4 wastewater injection well, whose oil and gas wastewater migration led to the flooding of 28 conventional production wells, documented another case of ODNR’s inability or unwillingness to pursue enforcement. Production well owners who noticed fluid in their wells contacted ODNR directly to report the incident. Inspectors, after waiting half a year and only after being prompted by a state representative-brokered meeting, discovered high pressures and oil and gas wastewater migration as far as five miles away from the wastewater injection well of concern. These concerns were not noted in the incident data, and did not result in a violation. Instead, Redbird Development LLC, the operator of Redbird #4, was allowed to submit voluntary changes to their operations and permits, plug only some of the geologic formation, and resume operations.
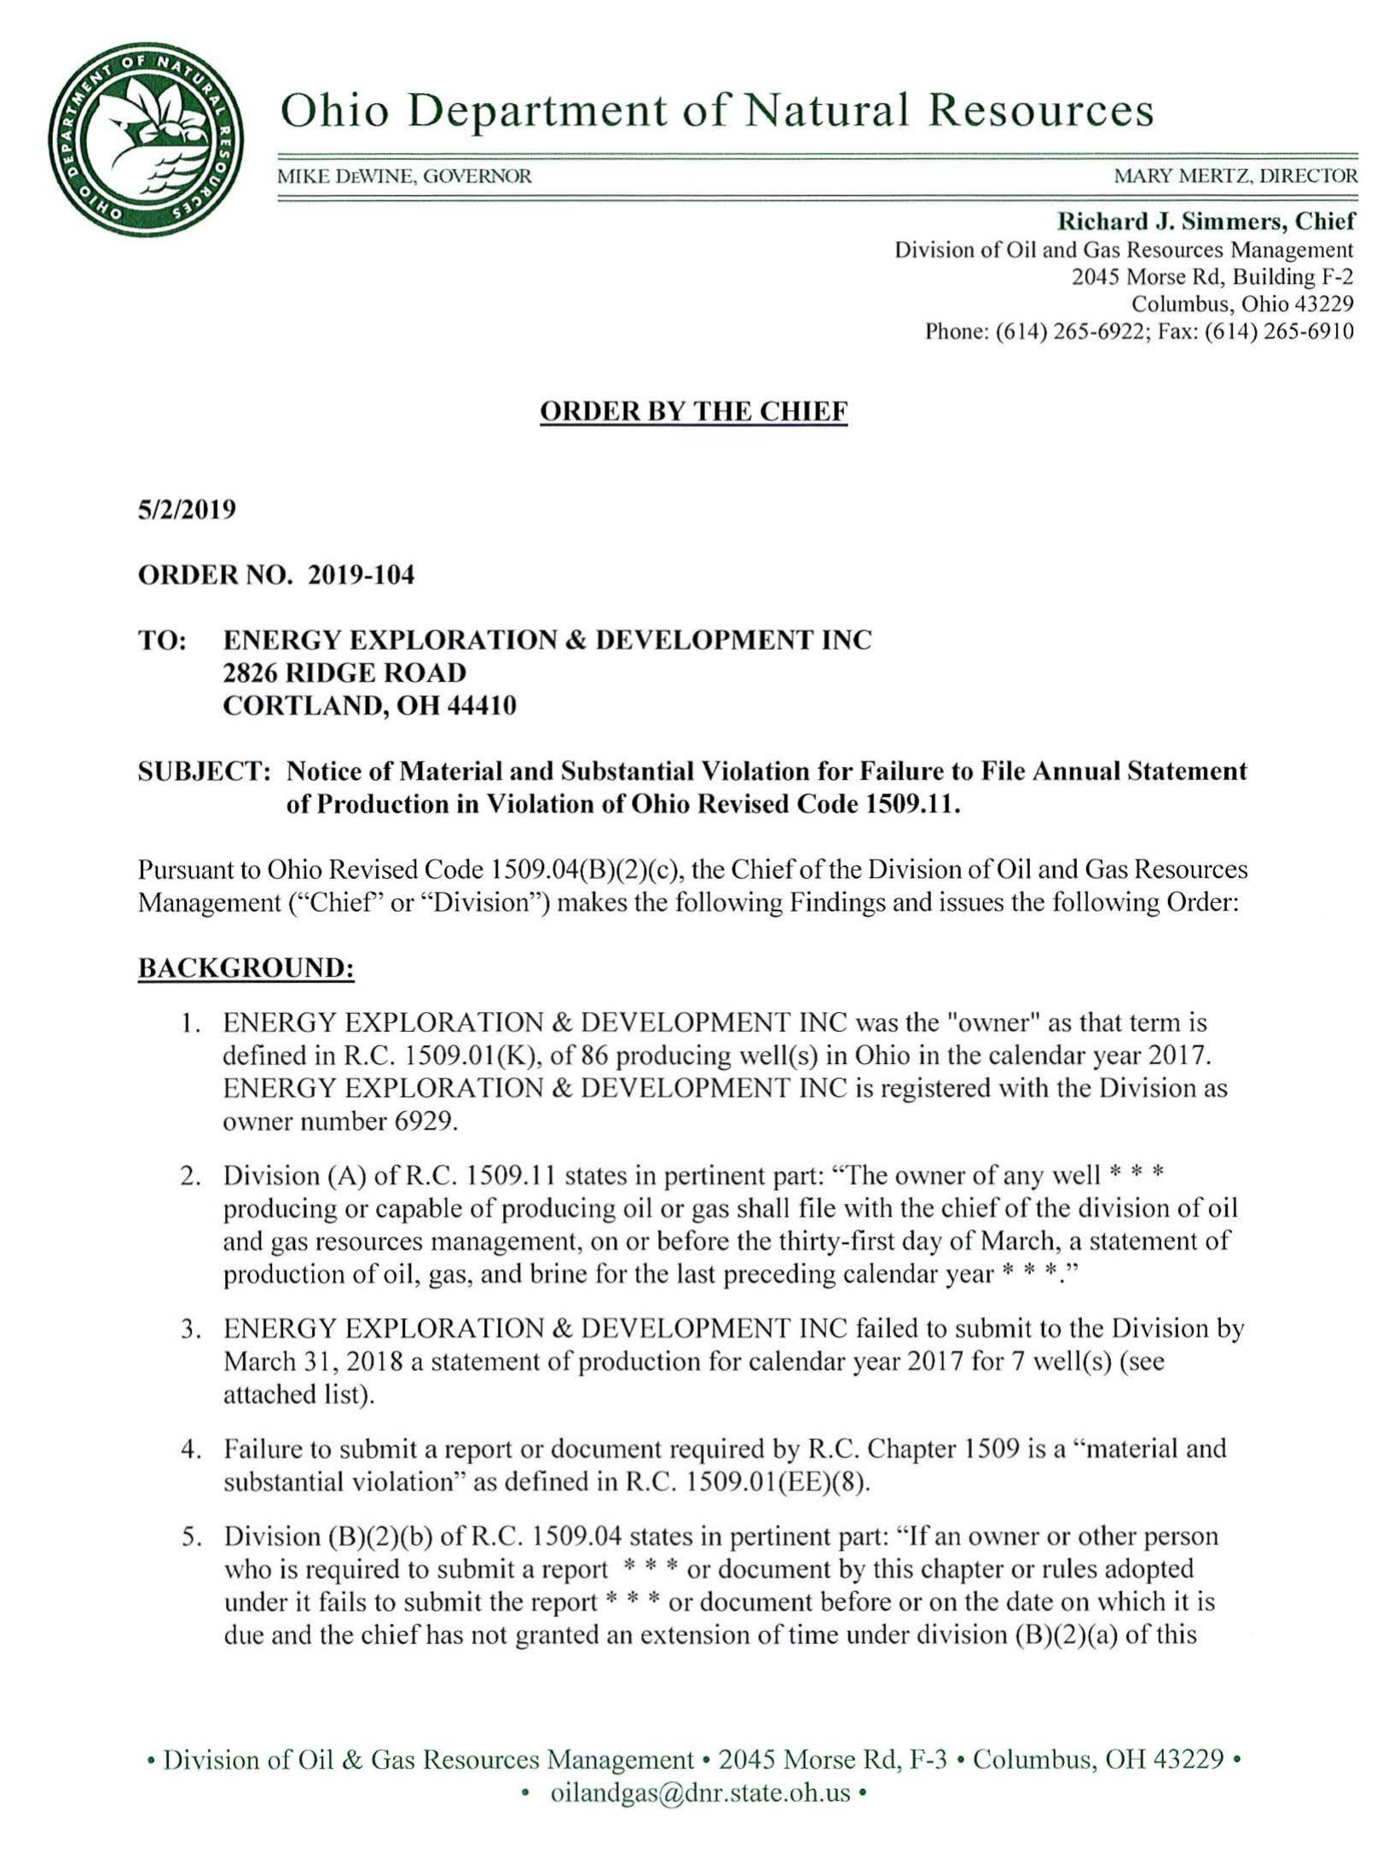
Rather than violations reflecting on-the-ground safety and pollution-related concerns and liabilities, violations are instead issued for administrative issues, like failing to report production amounts or failing to maintain liability insurance (Figure 10). Other Chiefs’ orders that appeared semi-regularly in the records were revocations of injection and plugging requests, but these records did not strongly indicate that any safety, health, or environmental incidents were considered in these plugging and revocation orders. When violations that could involve civil penalties are not pursued, ODNR forgoes potential revenue for Ohio and weakens financial deterrents against non-compliance that poses a risk to public health and the environment. While these plugging and revocation efforts are steps in the right direction, there is a need to better link incidents with accountability and enforcement.
Suggestions for Improvement of Incident Tracking and Enforcement
In order for the public to evaluate risks to their drinking water and health associated with oil and gas companies operating, or proposing to operate, in their communities, incident data must be more accessible. Accessible data allows residents, reporters, and regulators to quickly determine whether a company has a history of incidents or violations or if multiple violations have been issued regarding a particular type of well, such as wastewater injection wells. However, part of making data accessible includes having shared definitions of terms. If terms like “incident,” “conventional well,” and “closure date” were defined either in Ohio’s oil and gas code or within a separate data dictionary associated with the records, the public understanding of such events would be bolstered. Where Ohio’s definitions differ from definitions used in federal data or by other states, those differences should be made clear.
FracTracker commends ODNR for their improvements in data reporting, but there is still a distinct need for better protocols to address issues related to wells. As a starting point, Ohio Revised Code §1509.041 requires non-appealable material and substantial violations to be posted to ODNR’s website. To conduct this analysis, FracTracker Alliance had to submit a public records request to obtain this data, which did not appear on the dedicated webpage. At the time of finalizing this analysis, this information appears on the Orders by the Chief database, which aggregates all legal directives related to oil and gas in Ohio. The Chief’s Orders are not consistently displayed on the website, leading to gaps in regulatory transparency. In addition, records are only available starting in July of 2010. There is a need for distinction between these databases and webpages, consistent updates, and better transparency within these information systems. Additionally, ODNR’s RBDMS database, which contains oil and gas inspections by well in addition to well records on completion, permits, and production, while information-rich, is inaccessible to a majority of residents. It could be made more accessible to the public by having more frequent and timely updates and by linking it to accessible training on how to query and utilize the database. The database currently exists on Microsoft Access, which can be inaccessible due to its difficulty to use and paid licensing requirements. By moving the database to a different format, like SQLite, the public may have an easier time exploring the information available. This shift would also benefit ODNR; Microsoft Access has a 2-gigabyte size limit that the RBDMS system has outgrown, splitting the well history and well tables across two files the state tracks and undermining the purpose of a relational database.
Ohio law authorizes civil penalties for oil and gas violations, but ODNR’s DOGRM does not appear to have authority to impose those penalties directly through an administrative order. Instead, the division chief must request that the Ohio attorney general bring a civil action to recover penalties under Ohio Revised Code §1509.33. ODNR can independently use other enforcement tools, including compliance orders, permit suspensions, bond forfeiture, and referrals for injunctive relief. However, the absence of fines may make such notices, particularly the compliance orders, easy to disregard. Relatedly, in 2015, following a citizen’s petition filed by Buckeye Environmental Network and others, the U.S. EPA evaluated ODNR’s Underground Injection Control program. U.S. EPA said that they recommend implementing fines to hold bad actors accountable. To date, we are not aware of any instances of ODNR using the attorney general’s office to issue fines for companies violating Ohio’s injection well laws. This approach to enforcement may have allowed companies to avoid meaningful consequences for repeated violations.
FracTracker Alliance and Buckeye Environmental Network also recommend a smaller inspector-to-well ratio, so that wells are inspected with the regularity required to avoid oil and gas pollution events, leaks, and spills, otherwise referred to as “incidents”. Because of the length of time it takes for ODNR to inspect and address potential incidents and violations, more formal enforcement actions should be taken for long-running violations and incidents. In practice, these actions could include fines for any long-standing or unremediated violation or incident. In addition, violations or contamination events should result in an immediate stop-work order until the issue is remediated. This action would once again be bolstered by treatment of incidents as material and substantial violations, addressed with formal enforceable action through Ohio’s oil and gas code, rather than as separate tracking and enforcement measures.
Appendix A. Oil and Gas Wastewater Glossary
“Brine,” “Produced Water,” and “Oil and Gas Wastewater” are often used interchangeably, but come from different industry, legal, and regulatory contexts. To clarify, in this report we use “oil and gas wastewater” to encapsulate many terms that reference the often salty water that is brought above ground during extraction activities. This wastewater may be reused or injected back underground.
“Produced water” may be the term that most closely matches our definition of “oil and gas wastewater” but is not used by Ohio regulators or legislators, and may connote a substance that is not harmful. By using “oil and gas wastewater,” we aim to highlight the potential dangers of the fluids involved in extraction.
| Term | Source / used by | Meaning |
|---|---|---|
| Brine | Ohio’s Oil and Gas Code Definitions (1509.01-U) | “All saline geological formation water resulting from, obtained from, or produced in connection with exploration, drilling, well stimulation, production of oil or gas, or plugging of a well.” |
| Produced Water | U.S. EPA | “The fluid brought up from the hydrocarbon-bearing strata during the extraction of oil and gas, and includes, where present, formation water, injection water, and any chemicals added downhole or during the oil/water separation process.” Produced water is often re-used in oil and gas extraction via practices like Enhanced Oil Recovery. |
| Oil and Gas Wastewater | U.S. EPA, Sierra Club, FracTracker Alliance, and Buckeye Environmental Network | Naturally occurring saltwater that is already toxic, combined with flowback (fluids, sands, or hydrocarbons that return to the surface during fracking) and chemicals added during the extraction process. This wastewater may or may not be reused for further extraction, or injected underground. |
Sources and More Information
FracTracker’s work on this analysis
- Ohio oil and gas incidents, 2015–2025 (cleaned dataset)
- Ohio Class II injection wells of High Concern (2026)
- Ohio Oil and Gas Inspector analysis
- Chief’s Orders 2000-2025
- Ohio Oil and Gas Incident Map
Other sources
FracTracker Alliance. (n.d.). National Oil & Gas Well inventory portal. FracTracker Wells Portal. https://wells.fractracker.org/
Glabicki, Q. (2026, July 29). In Ohio, toxic wastewater is bubbling up out of the ground – The New York Times. The New York Times. https://www.nytimes.com/2026/07/29/climate/ohio-fracking-water-injection-wells.html
How much shale (tight) oil is produced in the United States? – frequently asked questions (FAQs) – U.S. Energy Information Administration (EIA). U.S. Energy Information Administration (EIA). (n.d.). https://www.eia.gov/tools/faqs/faq.php?id=847&t=6
Injection Wells | Ohio Department of Natural Resources. Ohio Department of Natural Resources. (n.d.). https://ohiodnr.gov/business-and-industry/energy-resources/injection-wells
Kington, D. (2026, February 19.). Lawsuit: Fracking waste company should pay for 2021 disaster. Athens County Independent. https://athensindependent.com/deeprock-fracking-waste-lawsuit-2/
Kington, D. (2026, September 17). Operator fights to reopen Injection Wells linked to disaster. Athens County Independent. https://athensindependent.com/deeprock-appeal-noble-county-injection-wells/
Klenke, G. (2025, January). Data gaps: A critical examination of oil and gas well incidents in Ohio. FracTracker Alliance. https://www.fractracker.org/2025/01/data-gaps-a-critical-examination-of-oil-and-gas-well-incidents-in-ohio/
Morgan, J. (n.d.). The Daily Accident Report-Ohio Oil & Gas. Facebook. https://www.facebook.com/profile.php?id=61560490386193&fbclid=IwY2xjawUjtrJleHRuA2FlbQIxMABwZG9mAWJyaWQRMUNaUWh1b0hFandWVlNEOHVzcnRjBmFwcF9pZBAyMjIwMzkxNzg4MjAwODkyAAEeOfiF2H8RYrQ1MtE_3pdzxPiGHKfT7UsUcSbvUiddUnG1hNTn2Qb7zU5wvFw_aem_xrdKMrnCWo8oqLGw-74_DQ
Nobel, J. (2025, March 24). Radioactive Shadow Workers | The treatment of oil and gas field waste is a dirty industry’s dirtiest secret. Sierra Club. https://www.sierraclub.org/sierra/2025-1-spring/feature/radioactive-oil-gas-shadow-workers
Ohio Department of Natural Resources. (2018, September 27). Incident guide (Reprint). https://dam.assets.ohio.gov/image/upload/ohiodnr.gov/documents/oil-gas/resources/IncidentGuide_RePrint%20FINAL%209272018.pdf
Ohio Department of Natural Resources – Division of Oil and Gas Resources Management. (2026, January 13). Risk Based Data Management System (RBDMS) inspection records for Kris Mar #1 (API Well No. 341672508400). State of Ohio. https://drive.google.com/file/d/1p2WERwDPnHJIwGKE6pU_0s9YtVHa9Ulb/view?usp=drive_link
Ohio Department of Natural Resources – Division of Oil and Gas Resources Management. (2026, July 20). CSI BIA package for “No change” filing for oil and gas definitions, permits, simultaneous operations, prevention of pollution and contamination, and safety rules. https://dam.assets.ohio.gov/image/upload/ohiodnr.gov/documents/oil-gas/rules/CSI_BIA_Package.pdf
Ohio Department of Natural Resources, Division of Oil and Gas Resources Management. (2024, October 28). Chief’s Order No. 2024-470: Arrowhead Road Services No. 1 (SWIW #27) Well API #34-167-2-9771-0000. State of Ohio. https://drive.google.com/file/d/1me8JvFj-pwTRJu7egzvhxtsY0I6QnjVv/view
Ohio Department of Natural Resources – Division of Oil & Gas Resources Management. (2021, January 25). Incident photograph log: Ohio Power-Gant #17-69 follow-up (Incident No. 2021015, API Well No. 34121232160000). https://drive.google.com/file/d/1j_S8vXkZGLOko5WzzrAkVzGgwCK49QMX/view
Ohio Department of Natural Resources — Division of Oil and Gas. Oil & Gas Commission.(n.d.). https://ohiodnr.gov/business-and-industry/municipalities-and-public-entities/commissions-and-councils/oil-gas-commission
Ohio Department of Natural Resources. (n.d.). Oil & Gas Inspections and enforcement. Resources. https://ohiodnr.gov/business-and-industry/energy-resources/required-inspections-and-enforcement/oil-gas-inspections-enforcement
Ohio Department of Natural Resources. (n.d.). Oil & Gas Well database. https://ohiodnr.gov/business-and-industry/energy-resources/well-information/featured-content-3
Ohio Department of Natural Resources. (n.d.). Public Database of Non-Appealable orders for Violations. https://ohiodnr.gov/rules-and-regulations/rules-and-regulations-by-division/oil-and-gas/public-database-of-non-appealable-orders-for-violations
Ohio Environmental Protection Agency. (n.d.). Emergency response. https://epa.ohio.gov/divisions-and-offices/emergency-response
Oil and Gas Production in Ohio. Ohio Legislative Service Commission. (2024, October). https://www.lsc.ohio.gov/assets/organizations/legislative-service-commission/files/oil-and-gas-production-in-ohio-october-2024.pdf
Orders by the Chief. Ohio Department of Natural Resources — Division of Oil and Gas. (n.d.). https://ohiodnr.gov/wps/portal/gov/odnr/discover-and-learn/safety-conservation/about-ODNR/oil-gas/oil-gas-resources
Physicians for Social Responsibility. (2022, September). Fracking with forever chemicals in Ohio. https://psr.org/wp-content/uploads/2022/09/fracking-with-forever-chemicals-in-ohio.pdf
Physicians for Social Responsibility. (2023, October). Compendium of scientific, medical, and media findings demonstrating risks and harms of fracking (9th ed.). https://psr.org/wp-content/uploads/2023/10/fracking-compendium-9.pdf
Ramsay, V. (2025, November 26). A decade of danger: Why ODNR is allowing Deeprock to restart suspended injection wells near Washington County water sources?. Buckeye Environmental Network. https://benohio.org/a-decade-of-danger-why-odnr-is-allowing-deeprock-to-restart-suspended-injection-wells-near-washington-county-water-sources/
Ramsay, V. (2026, July 14). Sixteen months of organizing. Four Wells shut down. Buckeye Environmental Network. https://benohio.org/sixteen-months-of-organizing-four-wells-shut-down/
Reed, B. (2026, July 2). Ohio Department of Natural Resources investigates leaking injection well, six years later the problem has gotten worse. Buckeye Environmental Network. https://benohio.org/ohio-department-of-natural-resources-investigates-leaking-injection-well-six-years-later-the-problem-has-gotten-worse/
Schlumberger. (n.d.). Unconventional resource. Energy Glossary. https://glossary.slb.com/en/terms/u/unconventional_resource
Section 1509.01: Division of oil and gas resources management – oil and gas definitions. Section 1509.01 – Ohio Revised Code | Ohio Laws. (n.d.). https://codes.ohio.gov/ohio-revised-code/section-1509.01
Section 1509.041: Database listing final nonappealable orders issued for violations to be accessible to public. Section 1509.041 – Ohio Revised Code | Ohio Laws. (n.d.). https://codes.ohio.gov/ohio-revised-code/section-1509.041
Section 1509.33: Civil penalties. Section 1509.33 – Ohio Revised Code | Ohio Laws. (n.d.). https://codes.ohio.gov/ohio-revised-code/section-1509.33
State of Ohio. (n.d.). Rule 1501:9-8-01: Definitions. Rule 1501:9-8-01 – Ohio Administrative Code | Ohio Laws. https://codes.ohio.gov/ohio-administrative-code/rule-1501:9-8-01
U.S. energy information administration (EIA). (n.d.). U.S. shale natural gas production has declined so far in 2024. Today in Energy. https://www.eia.gov/todayinenergy/detail.php?id=63506
U.S. Environmental Protection Agency. (n.d.-c). Oil and Gas Extraction Effluent Guidelines. https://www.epa.gov/eg/oil-and-gas-extraction-effluent-guidelines
U.S. Environmental Protection Agency. (n.d.-c). Unconventional Oil and Gas Extraction Effluent Guidelines. https://www.epa.gov/eg/unconventional-oil-and-gas-extraction-effluent-guidelines
U.S. Environmental Protection Agency, Region 5. (2015, September 8). Safe Drinking Water Act underground injection control program periodic program review: Ohio Class II (Final Report). https://drive.google.com/file/d/1ykPsxGbcD77zYM4THg-XhcP39awiRcEv/view
U.S. Environmental Protection Agency. (2016) Hydraulic Fracturing for Oil and Gas: Impacts from the Hydraulic Fracturing Water Cycle on Drinking Water Resources in the United States (Final Report). U.S. Environmental Protection Agency, Washington, DC, EPA/600/R-16/236F. https://cfpub.epa.gov/ncea/hfstudy/recordisplay.cfm?deid=332990
U.S. Environmental Protection Agency. (2016, June 28). Effluent limitations guidelines and standards for the oil and gas extraction point source category. Federal Register. https://www.federalregister.gov/documents/2016/06/28/2016-14901/effluent-limitations-guidelines-and-standards-for-the-oil-and-gas-extraction-point-source-category
U.S. Environmental Protection Agency. (2020, May). Summary of input on oil and gas extraction wastewater management practices under the Clean Water Act. U.S. Environmental Protection Agency, Washington, DC, EPA-821-S19-001. https://www.epa.gov/sites/default/files/2020-05/documents/oil-gas-final-report-2020.pdf
Washington County produced water investigation. Ohio Department of Natural Resources — Division of Oil and Gas. (n.d.-b). https://ohiodnr.gov/discover-and-learn/safety-conservation/about-ODNR/oil-gas/oil-gas-resources/washington-county-investigation
WOSU Public Media. (2023, September 20). The state of fracking in Ohio [Radio broadcast]. In All sides with Anna Staver. https://www.wosu.org/show/all-sides-with-ann-fisher/2023-09-20/the-state-of-fracking-in-ohio
Zuckerman, J. (2024, May). Fracking waste wells owned by an Ohio senator are leaking. The state paid $1.3 million to clean it up. Cleveland.com. https://www.cleveland.com/open/2024/05/fracking-waste-wells-owned-by-an-ohio-senator-are-leaking-the-state-paid-13-million-to-clean-it-up.html
Notes
- The term “incident” is undefined by the Ohio Department of Natural Resources and Ohio Oil and Gas Code, but used throughout this report to reflect the records request and associated responsive data. ↩
- Data for this analysis was requested and received in three tranches. The first set of data requested, which included incidents from 2014 through early September of 2023 was requested by Jenny Morgan and received in early 2024. The second set of data requested included records from the last part of 2023 through April of 2025, and was requested by Jenny in January of 2025 and received in May of 2025. The final data set included all of 2025 records, and was requested by FracTracker in February of 2026 and received in March of 2026. ↩
- This report uses “oil and gas wastewater” to describe the combination of naturally occurring toxic saltwater and flowback and chemicals incorporated to that water during the fracking process. Oil and gas wastewater is sometimes referred to as “brine” or “produced water,” in different contexts. These are distinct terms with distinct meanings but are often utilized interchangeably. For a more extensive description of these terms, see Appendix A. ↩
- Barrels is abbreviated as “bbls” in the records ↩
- While FracTracker received all Chief’s orders records from 2000-2025, Chief’s orders records from before 2019 were not systematically reviewed for the small, separate analysis and may be reviewed for future work. ↩
Acknowledgments: Special thanks to Anton Krieger, Becca Pollard, Roxanne Groff, and Bev Reed of Buckeye Environmental Network, whose review, on-the-ground knowledge of Ohio’s injection wells, and photographs shaped this report.
FracTracker Alliance helps communicate the risks of oil and gas and petrochemical development to advance just energy alternatives that protect public health, natural resources, and the climate.
By contributing to FracTracker, you are helping to make tangible changes, such as decreasing the number of oil and gas wells in the US, protecting the public from toxic and radioactive chemicals, and stopping petrochemical expansion into vulnerable communities.
Your donations help fund the sourcing and analysis of new data so that we can keep you informed and continually update our resources.
Please donate to FracTracker today as a way to advocate for clean water, clean air, and healthy communities.
Donate now

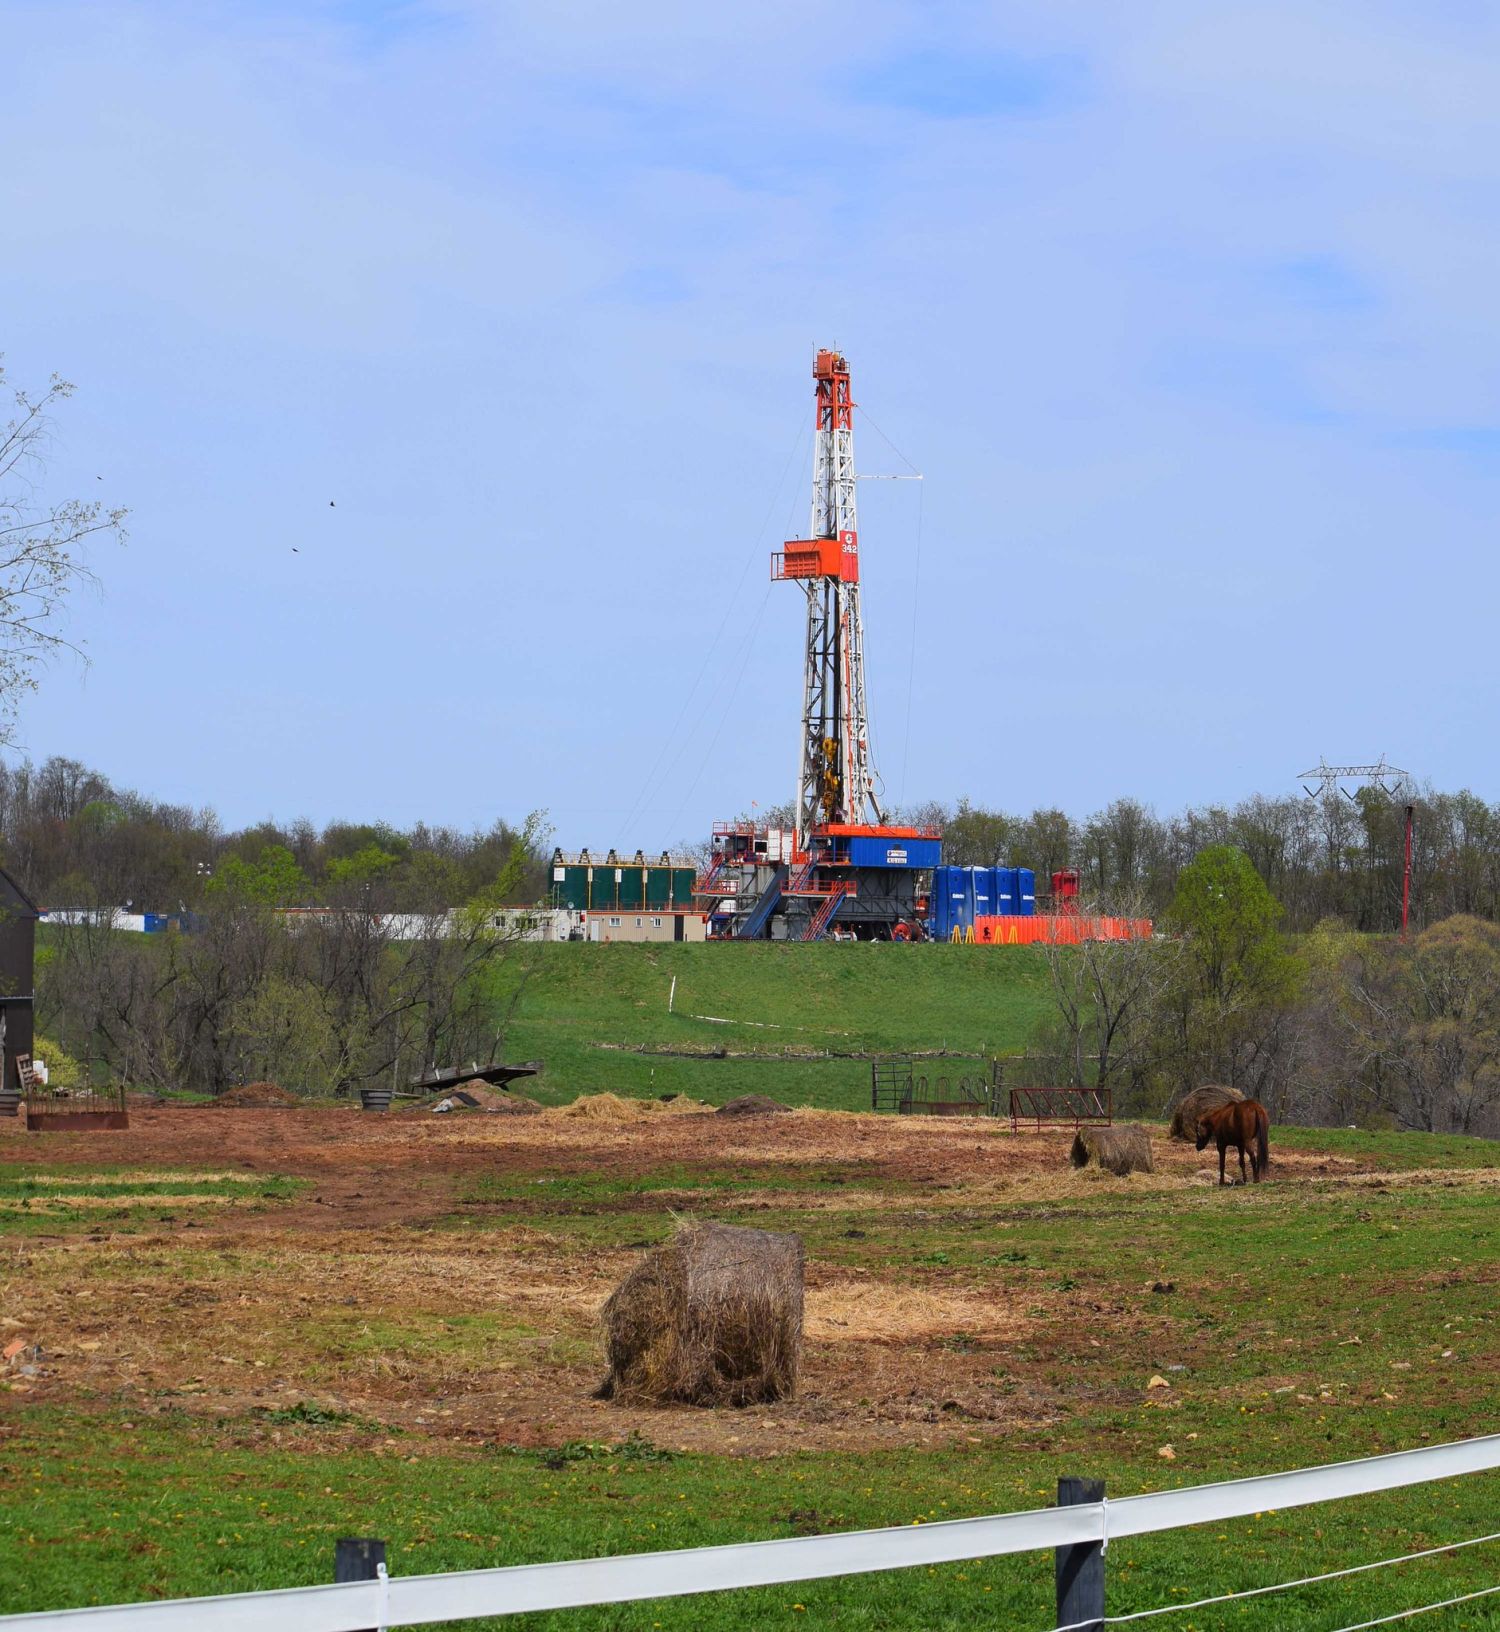




 Ted Auch, FracTracker Alliance, 2023

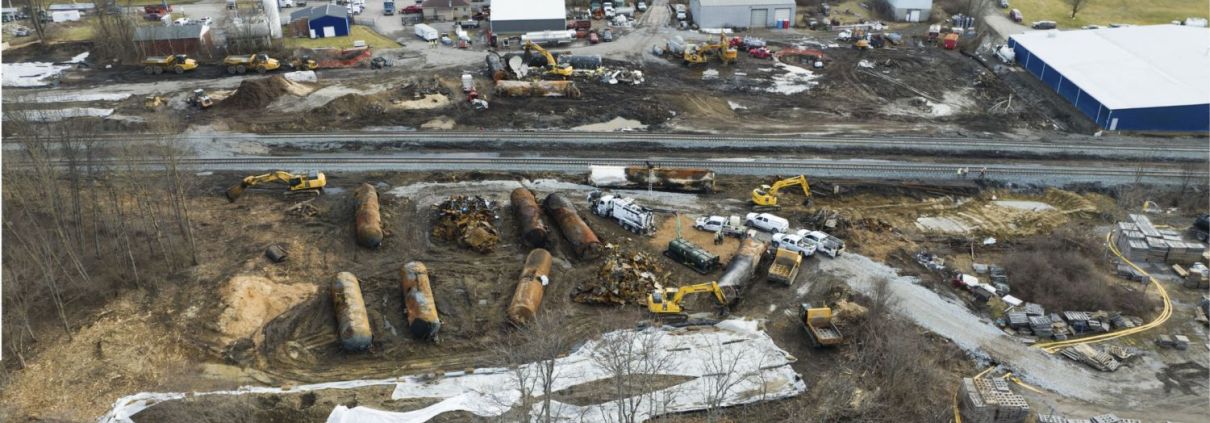
 Ross Environmental Hazardous Waste Incinerator in Eaton Township, Ohio. Ted Auch, FracTracker Alliance, 2023