
Tracking Pennsylvania’s Oil and Gas Waste in 2025
Overview
- Pennsylvania’s oil and gas wells reported generating 72.6 million barrels of liquid waste and over 825,000 tons of solid waste in 2025, with unconventional wells, which comprise less than 15% of the state’s inventory, accounting for 98.6% of liquids and 99.8% of solids.
- Nearly 50,000 conventional wells reported production but no waste at all, raising significant concerns about Oil and Gas operators exploiting gaps in the DEP’s reporting requirements.
- FracTracker and its partners worked together to obtain and analyze approximately 400,000 pages of required chemical-disclosure records, documenting high concentrations of radioactive and other hazardous contaminants in some Pennsylvania oil and gas waste.
- Much of the reported “disposal” is really transfer. Waste ends up in processing facilities, temporary storage, and landfills that leach, leaving the public to grapple with the burden of living near toxic, often radioactive, waste long after the state stops tracking it.
Introduction: The Price of Production
Pennsylvania produced over 7.8 trillion cubic feet of gas in 2025, a vast sum that is roughly equal to 16% of U.S. production and more than 5% of global production.
Along with production comes enormous quantities of waste – over 825,000 tons of solid waste and 72.6 million barrels (3 billion gallons) of liquids that need to be disposed of, according to the Pennsylvania Department of Environmental Protection’s waste data. As a point of comparison, the solid waste reported by oil and gas operators in Pennsylvania in 2025 alone weighs more than 2.2 Empire State Buildings. To get a sense of the volume of liquid waste, take a trip to Niagara Falls on a typical day, watching 757,500 gallons of water go over the falls every second, or take the boat ride for a more immersive experience. After watching for 67 minutes, you’ll see the equivalent amount of water as the waste fluids that were generated last year by Pennsylvania O&G wells.
Pennsylvania Oil and Gas Waste in 2025. Open the full map.
Terms
- Bbl — 42-gallon barrel, used for the measure of liquid waste.
- DEP — Pennsylvania Department of Environmental Protection
- mg/kg — Milligrams per kilogram, used for chemical concentrations. One mg/kg is equivalent to 1 part per million.
- O&G — Oil and gas
- RCRA — Resource Conservation and Recovery Act
- RWC — Residual Waste Code
- Tcf — Trillion cubic feet (gas measurement)
- Ton — Short ton (2,000 pounds)
The vast amount of O&G waste that comes with this scale of production is an enormous management problem in Pennsylvania, and beyond.
Where that waste ends up matters for workers, nearby communities and the environment. Oil and gas wastes can contain high concentrations of salts, hydrocarbons, metals, naturally occurring radioactive materials and other contaminants. Workers who handle, transport, process or dispose of these wastes may be exposed to hazardous chemicals, gases or radioactive materials, while spills, leaks or improper treatment and disposal can contaminate soil, groundwater and surface water and create risks for ecosystems and public health. Accurate waste reporting is therefore a basic safeguard: regulators, workers and the public need to know how much waste is being generated, what it contains, where it is going and how it is being managed in order to identify potential exposures, enforce waste-management requirements and understand which communities and facilities are bearing the burden of the industry’s waste.
In this article, we will take a closer look at some details of this process, including the different categories of waste, differences between waste streams from conventional and unconventional wells, a de facto waste reporting loophole for conventional operators, brine spreading, where the waste goes, and some example reports that include detailed chemical analyses revealing the high toxicity of liquid and solid waste.
Defining the Waste: Solids vs. Liquids
In the introduction, we discussed the two units that O&G waste is reported on in Pennsylvania – solid and liquid. This is a useful shorthand to encompass the waste stream, as there are 18 different categories of waste type that appear on DEP’s waste reports.
| Waste Type | Residual Waste Code (RWC) Description | Barrels | Pct. of Liquid Waste | Tons | Pct. of Solid Waste |
|---|---|---|---|---|---|
| Basic Sediment (in Barrels) RWC 807 | Sediment from Production Storage – sediment from storage of marketable oil and gas product. Does not include sediment from oil and gas-related wastewater storage. | 1,386 | 0.00% | ||
| Drill Cuttings (in Tons) RWC 810 | Drill Cuttings – oil and gas drill cuttings. [Rock encountered by the drill bit during boring] | 706,649 | 85.63% | ||
| Drilling Fluid Waste (in Barrels) RWC 803 | Drilling Fluid Waste – oil and gas drilling mud, other drilling fluids other than fracturing fluid and spent lubricant. [Reported in barrels] | 272,418 | 0.38% | ||
| Drilling Fluid Waste (in Tons) RWC 803 | Drilling Fluid Waste – oil and gas drilling mud, other drilling fluids other than fracturing fluid and spent lubricant. [Reported in tons] | 4,507 | 0.55% | ||
| Filter Socks (in Tons) RWC 812 | Filter Socks – Filters, filter socks and other media used to filter any oil and gas-related wastewater. Does not include filter socks mixed with RWC 804 for disposal purposes. Except where filter socks are mixed with RWC 804 and coded as RWC 804, mixed loads of RWC 812 with other waste for disposal purposes, such as drill cuttings, will be coded as RWC 812. | 69 | 0.01% | ||
| Other Oil & Gas Wastes (in Barrels) RWC 899 | Other Oil and Gas Wastes – all remaining oil and gas wastes other than those already covered under existing RWCs. Includes containment water. Does not include rainwater that is collected in a containment area that has not been mixed with residual waste. [Reported in barrels] | 1,862,509 | 2.56% | ||
| Other Oil & Gas Wastes (in Tons) RWC 899 | Other Oil and Gas Wastes – all remaining oil and gas wastes other than those already covered under existing RWCs. Includes containment water. Does not include rainwater that is collected in a containment area that has not been mixed with residual waste. [Reported in tons] | 14,797 | 1.79% | ||
| Produced Fluid (in Barrels) RWC 802 | Produced Fluid – includes flow-back, brine and any other formation fluids recovered from the wellbore. Flow-back is defined as fracturing/stimulation fluids, including any colloidal and suspended solids within the fluid, recovered from the wellbore after injection into the wellbore. [Reported in barrels] | 70,294,327 | 96.80% | ||
| Produced Fluid (in Tons) RWC 802 | Produced Fluid – includes flow-back, brine and any other formation fluids recovered from the wellbore. Flow-back is defined as fracturing/stimulation fluids, including any colloidal and suspended solids within the fluid, recovered from the wellbore after injection into the wellbore. [Reported in tons] | 54,632 | 6.62% | ||
| Servicing Fluid (in Barrels) RWC 808 | Servicing Fluid – oil and gas production well maintenance/work over fluids, oil/water-based mud and foam and well cellar cleanout waste after drilling operations have been completed. Does not include well cellar cleanout waste covered under existing RWCs, well cellar fluids that are recycled/reused, or rainwater that is collected in a well cellar that has not been mixed with a residual waste. [Reported in barrels] | 129,008 | 0.18% | ||
| Servicing Fluid (in Tons) RWC 808 | Servicing Fluid – oil and gas production well maintenance/work over fluids, oil/water-based mud and foam and well cellar cleanout waste after drilling operations have been completed. Does not include well cellar cleanout waste covered under existing RWCs, well cellar fluids that are recycled/reused, or rainwater that is collected in a well cellar that has not been mixed with a residual waste. [Reported in tons] | 1,783 | 0.22% | ||
| Soil Contaminated by Oil & Gas Related Spills (in Barrels) RWC 811 | Soil Contaminated by Oil and Gas-related Spills – soil contaminated by spills of RWCs 802, 803, 805, 807, 808, 809 and 810. Soil contaminated by spills of RWC 804 will be coded using RWC 804. Soil contaminated by spills of RWC 812 will be coded using RWC 812. [Reported in barrels] | 2 | 0.00% | ||
| Soil Contaminated by Oil & Gas Related Spills (in Tons) RWC 811 | Soil Contaminated by Oil and Gas-related Spills – soil contaminated by spills of RWCs 802, 803, 805, 807, 808, 809 and 810. Soil contaminated by spills of RWC 804 will be coded using RWC 804. Soil contaminated by spills of RWC 812 will be coded using RWC 812. [Reported in tons] | 20,440 | 2.48% | ||
| Synthetic Liner Materials (in Tons) RWC 806 | Synthetic Liner Materials – includes well site liners, liners used in pits or other approved storage structures, freshwater impoundments, centralized impoundments, or used in conjunction with primary containers. | 6,486 | 0.79% | ||
| Unused Fracturing Fluid Waste (in Barrels) RWC 805 | Unused Fracturing Fluid Waste – oil and gas fracturing/stimulation fluid waste and fracturing sand waste that has not been injected into a wellbore. | 40,631 | 0.06% | ||
| Unused Fracturing Fluid Waste (in Tons) RWC 805 | Unused Fracturing Fluid Waste – oil and gas fracturing/stimulation fluid waste and fracturing sand waste that has not been injected into a wellbore. | 224 | 0.03% | ||
| Waste Water Treatment Sludge (in Barrels) RWC 804 | Wastewater Treatment Sludge – sludge and solids generated during the processing of any oil and gas-related wastewater including any sediment generated during storage of oil and gas-related wastewater. Mixed loads of wastewater treatment sludge with other waste for disposal purposes, such as filter socks (RWC 812), will be coded as RWC 804. [Reported in barrels] | 15,086 | 0.02% | ||
| Waste Water Treatment Sludge (in Tons) RWC 804 | Wastewater Treatment Sludge – sludge and solids generated during the processing of any oil and gas-related wastewater including any sediment generated during storage of oil and gas-related wastewater. Mixed loads of wastewater treatment sludge with other waste for disposal purposes, such as filter socks (RWC 812), will be coded as RWC 804. [Reported in tons] | 15,623 | 1.89% | ||
| Total Result | 72,615,367 | 100.00% | 825,209 | 100.00% |
Table 1: O&G waste by type in 2025. Waste data was downloaded from Pennsylvania DEP on June 16, 2026. Waste type descriptions from Pennsylvania DEP, with FracTracker comments in square brackets.
The 70,294,327 barrels of produced fluids represents 96.8% of the volume of all of the liquid waste reported by Pennsylvania operators. For solids, drill cuttings accounted for 85.6% of the mass, weighing in at 706,649 tons. Both waste types carry a heavy contaminant load, mostly from naturally occurring but toxic components that had previously been locked away deep in the earth’s crust.
DEP has changed how it classifies these categories of oil and gas waste numerous times in recent years. Because of these frequent changes in DEP classifications, any analysis of waste types from year to year should be conducted with significant attention to these details. In the 2018 rules, for example, produced fluids were categorized as Residual Waste Code (RWC) 802, while fracturing fluid waste, including the fluid that comes up in the first 30 days of operation that has a higher proportion of injected chemicals (frequently called flowback fluid) was classified as RWC 805. See pages 22-23 of the 2018 reporting manual for more details. With the 2022 rules, both waste types are now reported together under RWC 802. Several changes were made to the list of RWC codes in 2016, as well.
In comparison, aggregating the data by the units of measure, with tons representing solid waste and barrels representing liquid waste is a straightforward concept that holds steadily from year to year, making it a convenient metric to work with. Reducing the number of categories makes understanding other aspects of waste, such as transportation and disposal methods, less chaotic to talk about as well.
At the same time, it must be stated that from the point of view of data analytics of oil and gas waste, this level of detail is really an embarrassment of riches when compared to other states. Places like Ohio and West Virginia only include a “water” column in their production data, with no mention of leftover fracking chemicals, drilling mud, tank sediments, pond liners, or other waste streams. Pennsylvania’s detailed reporting makes meaningful public analysis possible, and highlights the need for residents living in other states to demand similar levels of transparency from their own regulators.
Conventional vs. Unconventional Sources
Pennsylvania classifies oil and gas wells as either conventional or unconventional. While both types of wells are usually fracked, unconventional wells use dramatically more fluid – while a conventional well might use tens of thousands of gallons of water per well, an unconventional operation frequently will use tens of millions of gallons per well.
On the production side of the equation, FracTracker quantified the outsized nature of Pennsylvania’s unconventional wells. With around 14.6% of the total inventory, those wells contributed more than 99% of the state’s gas and condensate totals, and about 14.5% of the state’s oil, roughly proportional in that last category to the number of wells it represents. Let’s see how the numbers stack up for waste.
| Category | Well Count | Liquid (Barrels) | Liquid per Well (Barrels) | Percent Liquid | Solid (Tons) | Solid per Well (Tons) | Percent Solid |
|---|---|---|---|---|---|---|---|
| Conventional | 23,662 | 1,016,059 | 42.9 | 1.4% | 1,263 | 0.1 | 0.2% |
| Unconventional | 12,816 | 71,599,308 | 5,586.7 | 98.6% | 823,946 | 64.3 | 99.8% |
| All Wells | 36,479 | 72,615,367 | 1,990.6 | 100.0% | 825,209 | 22.6 | 100.0% |
We can see that unconventional wells are once again in the driver’s seat for Pennsylvania’s waste stream, accounting for 98.6% of the state’s liquid waste by volume and 99.8% of the solid waste by mass. This certainly makes sense, given the immense scale of the unconventional operations, as discussed above. Additionally, most of the new drilling activity is unconventional, and one would expect increased waste streams with newer wells, including higher volumes of waste fluids to accompany the higher production levels, as well as the presence of drill cuttings.
Because of these variables, it’s worth taking the per well values on Table 2 with a splash of brine, especially on the solids side —older wells won’t contribute any drill cuttings, for example. But the mean values still give a sense of the differing scales of conventional and unconventional wells. Conventional wells average 42.9 barrels of liquid waste and 0.1 tons of solid waste per year, while their unconventional counterparts average 5,587 barrels and 64.3 tons
Nonreporting Conventional Wells
Another eye-opening item on Table 2 is that it only includes data from 23,662 conventional wells. As a point of comparison, the production report from the same time period and subset includes data from 79,836 wells, or almost 3.4 times as many. This situation is worth a closer look.
| Category | Production Report – All Wells | Production Report – Wells Reporting Production | Waste Report – All Wells | Waste Report – Wells Reporting Waste | Difference (P-W: All Wells) | Difference (P-W: Reporting Production or Waste) |
|---|---|---|---|---|---|---|
| Conventional | 79,836 | 71,743 | 23,662 | 23,198 | 56,174 | 48,545 |
| Unconventional | 13,691 | 12,709 | 12,816 | 12,801 | 875 | -92 |
| All Wells | 93,527 | 84,452 | 36,478 | 35,999 | 57,049 | 48,453 |
While there were 56,174 fewer conventional wells listed on the waste report than were on the production report for 2025, a little more nuance is merited here. Operators sometimes have reasons for not producing (it could be shut-in, an injection well, etc.), so it is also worth looking at the number of wells that report any non-zero values on these reports. There are still about 3.1 times as many conventional wells on the production report than the waste report for this variable, for an overall difference of 48,545 wells.
Note that this waste reporting phenomenon does not seem to be an issue with unconventional wells. Our data actually show 92 more wells on the unconventional waste reports than on the production reports in instances where non-zero values are counted. This is likely explained by the fact that the download date of our waste data is almost three months after when the production data was obtained, and DEP does accommodate stragglers in these reports.
To our mind, the sharp contrast between the percentage of conventional and unconventional wells that submit data to the waste reports requires some sort of explanation. In fact, O&G wells are known to frequently “water out,” a phenomenon where the ratio of waste fluids to hydrocarbons increases over time. Authors of a 2024 publication on the topic looked at data from more than 153,000 wells in 18 different plays. This didn’t include data from Pennsylvania, however, noting:
Because of apparent widespread irregularities with water production data from Pennsylvania, we did not include the Marcellus Formation in our analyses.
Conventional operators not reporting data to DEP is not a new problem. In late 2022, DEP released a report detailing some of the compliance issues with operators of conventional wells, specifically calling out failures to submit reports for waste as one of the common themes.
Over the past five years, DEP’s OOGM has identified significant non-compliance with laws and regulations in the conventional oil and gas industry, particularly regarding improper abandonment of oil and gas wells, as well as reporting requirements for hydrocarbon and waste production and mechanical integrity assessments
Governor’s Lapsing Statement Report, December 29, 2022
However, on Table 3 (page 8) of that report which shows the top violations for conventional wells between 2017 and 2021, you can see that there were 1,827 administrative violations issued for failure to report annual production or status reports, and 722 more were issued a similar violation with slightly different wording, most likely representing an adjustment to the phrasing over the five-year period. However, we don’t see the lack of waste reporting on this top 10 list.
It turns out that there is a good reason for this. While operators need to report production or explain their lack of reporting, the same is not true of waste reporting. When I asked about the tens of thousands of fewer wells on the waste report in an email correspondence, DEP Mineral Resources Program Specialist Paul Howard explained the discrepancy:
A comment is required when production is not reported, but a comment is not required when only production is reported and no waste. To identify a violation, there would need to be some other indication that waste was generated but not reported.
Paul Howard, Mineral Resources Program Specialist, Pennsylvania DEP
So while not reporting production or explaining non-production with a comment is a violation, the same is not true of waste. Without applying the same reporting standard in an industry where non-compliance is already rampant, it seems like DEP would need to be extraordinarily lucky to stumble across these “other indications” of unreported waste generation.
Brine Spreading
One way DEP might be able to find omissions in waste reporting is by taking a closer look at waste disposal methods, particularly brine spreading. In 2024 testimony before the Pennsylvania House Environmental Resources & Energy Committee, DEP explained that the department used to allow the practice of spreading oil and gas liquid waste on roadways for dust suppression and de-icing, but banned the practice for waste from unconventional wells in 2016. With respect to waste from conventional wells, the picture is less clear. DEP has supported a statutory ban of road-spreading brine from conventional wells and claims it will not authorize the practice in the face of concerns that contaminants will reach the waters of the Commonwealth. Whether the practice is actually illegal, however, remains untested.
In DEP’s discussion of the issue, the language reads as both clunky and purposeful. For example, in the opening paragraph, the testimony reads:
As noted below, road spreading of brine is currently not an authorized practice in Pennsylvania and DEP has the authority to take enforcement action in instances where it becomes aware of spreading that violates the laws or regulations that DEP implements.
Pennsylvania DEP testimony, House Environmental Resources & Energy Committee, 2024
A non-authorized practice is not the same as a banned practice. There may be no legal mechanism by which DEP will authorize brine spreading, but that does not mean that DEP considers the practice to be illegal. Other than the proximity of the words, there is no actual indication that the enforcement actions for violations actually apply in this situation.
A bit later, the testimony states:
In 2017, the DEP discontinued the practice of authorizing brine use for dust suppression purposes under the guidance document. Since that time, the DEP has not authorized the use of brine as a dust suppressant under the 1998 guidance document or the Commonwealth’s Oil and Gas Act.
Pennsylvania DEP testimony, House Environmental Resources & Energy Committee, 2024
Once again, we have very specific language where the Department asserts that it “discontinued the practice of authorizing” the use of this waste, but here, it mentions only dust suppression, and omits any reference to brine spreading for deicing purposes.
Also discussed is the issue of coproduct determination, which is essentially a process that would indicate that an apparent waste product is no longer considered to be waste:
A coproduct determination, which shall be made in accordance with § 287.8 (relating to coproduct determinations), only applies to materials that will be applied to the land or used to produce products that are applied to the land….A material meeting these requirements does not require a waste permit for the use of the material, but the laws and regulations regarding the protection of water quality still apply to its use.
Pennsylvania DEP testimony, House Environmental Resources & Energy Committee, 2024
This could be interpreted as a sizable loophole in the waste reporting requirements. Would a determination that brine is a coproduct (and therefore not a waste product at all) apply retroactively to the point of production, exempting the operators of 48,545 conventional wells from reporting their waste totals, so long as it was used in such a manner?
Interestingly, the testimony goes on to state that DEP reached out to each of the 26 operators who reported disposing of waste via brine spreading on Pennsylvania roads in 2021. Two of these said that brine spreading was reported in error, 13 said that they would stop the practice, “Two operators responded with information that did not constitute a valid coproduct determination,” and nine more simply didn’t reply.
In 2026, despite DEP’s testimony of “discontinued the practice of authorizing” brine spreading, we hear continued reports of the ongoing use of the practice. Perhaps the real lesson learned by operators was simply not to report such usage, so as not to be hassled by the Department.
Destination and Disposal
Oil and gas development generates both liquid and solid wastes that must ultimately be reused, processed or disposed of. Liquid waste such as produced water may be reused in the development or hydraulic fracturing of other wells, sent to facilities for processing or treatment, or disposed of in underground injection wells. Solid wastes, including drilling wastes, may be sent to processing or permitted disposal facilities such as landfills. The waste reports are intended to track these movements from the well where the waste was generated to the destination and management method reported by the operator.
| Disposal Method | Liquids (Bbl) | Solids (Tons) |
|---|---|---|
| Centralized Waste Treatment Facility (NPDES Discharge) | 18,873 | 0 |
| Centralized Treatment Plant (for Recycling) | 909,498 | 19 |
| Injection Disposal Well | 4,479,583 | 6,388 |
| Landfill | 137 | 697,590 |
| On-Site Encapsulation | 2 | |
| On-Site Pit | 123 | |
| Public Sewage Treatment Plant | 207,698 | 909 |
| Residual Waste Processing Facility | 22,782,031 | 81,160 |
| Residual Waste Transfer Facility | 1,539 | 4,455 |
| Reuse (at Well Pad) | 31,024,145 | 21,846 |
| Reuse at a Conventional Well Site in Pennsylvania | 126,502 | |
| Reuse at a Well Pad Outside Pennsylvania | 2,819,098 | 2,496 |
| Reuse Other than Road Spreading | 22,505 | 135 |
| Road Spreading | 285 | |
| Storage Pending Disposal or Reuse | 7,753,140 | 9,817 |
| Surface Impoundment | 2,470,206 | 393 |
| Total Result | 72,615,367 | 825,209 |
As established above in the Nonreporting Conventional Wells section, missing data is a part of the story. Acknowledging that, this section is focused on what is actually disclosed by the various operators, who reported sending the waste from Pennsylvania’s O&G wells to 532 destinations in seven states.
Some of these destinations are not a single location. For example, 126,387 barrels of waste was sent to a destination entitled, “Conventional wells report does not require reuse location,” noting another distinction between conventional and unconventional waste requirements. Destination descriptions for waste sent to out of state wells for the purpose of reuse are similarly vague, such as the 27,498 barrels destined for “Reuse at Ohio well pad” or the 346 barrels sent for “Reuse at Montana well pad.”
The report also can’t answer why an operator called “Loan Asset Issuer LLC Series 2021 NG-1” would choose to send a couple of tanker trucks worth of produced fluid from a well called “Consol WFN6HHS” in West Finley Township, Washington County more than 1,500 miles for reuse at a Montana well pad. We just know that it happened, according to the operator’s disclosure.
Uncovering every curiosity in the waste reports would be like describing every piece of hay in a haystack, so at some point, it’s useful to step back and look at the overall trends. For this, we invite you to take a look at the waste map linked above, which includes aggregated solid and liquid waste totals for receiving facilities that we were able to map. This was quite a process as well, because there are three different ways that the operators can indicate the location of the receiving location, and even so, there are widespread reliability issues.
For example, there are data columns for well pad latitude and longitude for when operators reuse the waste at a different well pad, but instead they often put the location of the well pad that the waste originated from. There is a different set of coordinates for other waste facilities, or they can use addresses. Sometimes, the addresses are clearly corporate offices, and sometimes, none of these are filled out. Because of this, we cross-referenced with other sources, including DEP’s well pad and waste facilities reports, and double checking these using Google Maps for plausibility. For the aggregated sites such as “Reuse at Ohio well pad,” we simply had to pick a location.
Because of this confusion, we have categorized these receiving facilities based on our overall confidence of the location’s accuracy, with purple square icons indicating high confidence, where we believe we have the correct facility location, brown showing medium confidence, where location accuracy issues are thought to be at the county level or less or else some inconsistencies were noted, such as the use of well pad ID numbers that weren’t found on the well pad report, and red showing low confidence, with location uncertainty greater than the county level. That said, our tools for making these assessments are imperfect, so if you would notice any errors, we would very much appreciate your feedback.
Another way to understand the flow of waste is to visualize them through Sankey charts. Here, we have separate charts for waste reported in tons and barrels. Within each one, we include all of the specific waste types that contribute to the total, the states that the waste was sent to, as well as the disposal method.
Figure 1: Chart showing waste type, receiving destination, and disposal method of solid waste generated in Pennsylvania in 2025. Waste data for this chart was downloaded from Pennsylvania DEP on June 16, 2026.
Mousing over any part of this chart gives more information about what we are seeing. On the left half of the map, the proportional-width strands are color coded to indicate the state they they are destined for, with waste staying in Pennsylvania shown in blue, Ohio-bound waste in orange, and waste headed for sites in West Virginia in green, with other locations shown in grey. On the right side, the strands reorganize to indicate the disposal method indicated by the operators.
On the top left, we see that drill cuttings are the real driver of solid waste, accounting for about 707,000 out of 825,000 tons, almost 86% of the total. Of this, about 589,000 tons (83%) stayed in Pennsylvania, with around 114,000 tons (16%) headed to Ohio and 3,700 tons (0.5%) to West Virginia. These proportions vary by the specific category. For example, the Mountain State does take larger proportions of produced fluids that were reported in tons, accepting around 15,000 tons of almost 55,000 tons (28%) in that category.
Let’s take a look at the flow of the liquid waste.
Figure 2: Chart showing waste type, receiving destination, and disposal method of liquid waste generated in Pennsylvania in 2025. Waste data for this chart was downloaded from Pennsylvania DEP on June 16, 2026.
Operators reported nearly 70.3 million barrels of produced water, representing almost 97% of all waste reported in barrels. About 63.3 million barrels of the produced water stayed in-state, or about 90%. For all liquid waste, 65.4 out of 72.6 million barrels stayed in the Keystone State, also about 90% of that total.
If we take disposal methods into account, we can see some more nuance. For example, a little under 4.5 million barrels (6%) of all liquid waste is reported going to injection wells for disposal. However, Pennsylvania does not have very many injection wells compared to our neighbors, so in this subcategory, Ohio actually accepts three times the amount of waste as Pennsylvania does, with around 3.4 million barrels going to the Buckeye State compared to 1.1 million barrels staying in Pennsylvania, as was recently pointed out in the New York Times using FracTracker analysis. Less than 4,200 barrels (0.09%) was sent to West Virginia’s injection wells, and about 17,000 barrels were sent to an injection well where the state was not indicated. Some further research on that last item shows that the injection well in question, CNR East Warrent 3131 T10, is an enhanced oil recovery injection well operated by Pennhills Resources in McKean County, Pennsylvania.
It is important to note that we don’t have comparable data from other states to quantify the amount of waste that might be headed to Pennsylvania, as Ohio and West Virginia do not have waste reports with the destination data that the Pennsylvania report provides. The general assumption is that since Pennsylvania is the largest producer of the three states with almost 7.7 trillion cubic feet (Tcf) of gas compared to 3.6 Tcf in West Virginia and 2.1 Tcf in Ohio, that it generates more waste and furthermore, it would seem plausible that the net flow of the subset of waste that crosses state lines travels from Pennsylvania to its neighbors. Without data showing the destination of Ohio and West Virginia, however, that remains little more than a hunch.
Another thing to point out is that some of the disposal methods don’t really seem like endpoints in the story of the waste, but it is where we lose track of it from these oil and gas waste reports. For example, 7.75 million barrels of liquids are sent to “storage pending disposal or reuse.” That amounts to almost 11% of the total volume of liquid waste, and almost 3.3 million barrels more than waste sent to injection wells. Almost 2.5 million barrels, more than 3% of the total, were sent to surface impoundments, but it seems unlikely that the waste would remain there in perpetuity. And while residual waste processing facilities sounds like a reasonable destination for the 22.8 million barrels (31%) of liquid waste and 81,000 tons (10%) of solid waste, these facilities have their own waste streams and impacts, and while the overall contaminant load may originate from oil and gas wells, from the point of view of DEP’s O&G waste report, it is a sort of black hole. Once the waste trucks pass the gates of these facilities (or the “event horizon” in our metaphor), we lose track of it forever as oil and gas waste. For that matter, even the 698,000 tons of solid waste sent to landfills isn’t quite an endpoint, either, as some of the contaminants including radioactive materials and heavy metals percolate through the landfill to produce leachate every time it rains, presenting yet another waste mitigation conundrum.
What Contaminants are in the Waste?
Oil and gas waste often contains radioactive, carcinogenic and other highly hazardous materials at levels far exceeding guidelines for human safety. Yet, thanks to an industry loophole, Pennsylvania O&G waste is defined as a kind of residual waste, which is supposed to represent nonhazardous industrial waste. The nonhazardous status traces back to the 1980 Bentsen Amendment to the Resource Conservation and Recovery Act (RCRA), which exempted oil and gas waste from Subtitle C, the portion of RCRA that regulates hazardous waste. While New York has taken action to close this loophole in their state law and allow hazardous waste standards to be applied to O&G waste streams, Pennsylvania has not.
Of course, just because the waste is defined residual and not hazardous waste doesn’t mean that the waste is safe to be around. Pennsylvania, to its credit, “requires residual waste generators to submit information annually to the Department, for every waste stream they produce.” This is achieved through the submission of Form 26R, a form that requires detailed chemical analysis of waste every five years. The rules for this disclosure are as follows:
- Generators of all residual waste streams, including O&G operators, are required to complete Form 26R for each waste stream to the facility where the waste is processed or disposed
- This must be accompanied by a detailed chemical analysis for each waste stream. The law states three different frequencies of this auxiliary report
- Annual is the default standard
- Operators can declare that the chemical analysis remains approximately the same and test every five years instead
- The chemical analysis waiver can be extended beyond the five-year window for certain categories of waste
The generator is required to submit a copy of Form 26R for each waste stream to the solid waste management facility where the waste is sent for processing or disposal. After initial submission of a detailed chemical analysis for a waste stream, the waste generator may select to certify annually by providing sufficient documentation that the chemical and physical characteristics of the waste and the processes by which the waste was generated have not changed from the previous year submission, in lieu of annually performing the chemical analysis. The waste will have to be fully characterized every five (5) years even if no changes in the process generating the waste or the characteristics in the waste have occurred. For the categories of residual wastes that are covered in Section D of Form U, the chemical analysis waiver can be extended beyond the five-year period as long as there are no changes in the manufacturing process or ingredients that may result in changes to the waste characterization or chemical composition of the waste.
While oil and gas operators have been required to submit this form, the information has not been broadly available to the public until a recent concerted effort by Earthjustice, Ohio Valley Allies, WildEarth Guardians and FracTracker. On behalf of Ohio Valley Allies, Earthjustice submitted a Right-to-Know Law request for all O&G 26R reports since 2015 for unconventional wells, a massive amount of previously hard to access data about the chemical composition of PA’s oil and gas waste. Since many of these reports had not been digitized, Jill Hunkler of Ohio Valley Allies, Melissa Troutman of WildEarth Guardians, and others went to great lengths and spent several days scanning roughly 400,000 pages. Gary Allison, a consultant for FracTracker, subsequently assembled and began a preliminary analysis of the released Form 26R reports. This collaborative effort supplied key data for a recent New York Times investigation, which found that four injection wells near Marietta, Ohio, accepted wastewater from Pennsylvania fracking sites reporting median radium-226 levels 428 to 1,800 times EPA’s drinking-water standard.
At the same time, FracTracker’s review of these released 26R reports suggests that these 400,000 pages didn’t contain every chemical analysis that would be expected under the five-year reporting schedule. Section D of Form U allows the chemical-analysis waiver to be extended for certain categories of residual waste, but it does not clearly state whether oil and gas waste qualifies for such an extension. It therefore remains unclear whether the apparent gaps reflect DEP not producing every responsive record, operators failing to file required reports, or the use of extended waivers and other interpretations of the reporting requirements. Despite these limitations, the 26R reports contain chemical analyses that document very high concentrations of hazardous contaminants in some oil and gas waste streams.
Below are two examples of these chemical analysis reports, one for drill cuttings and the other for wastewater.

This document starts with the 26R report. In Section A on the first page, we can see that this waste sample is from the Alexander Bra Pad, a well operated by Chesapeake in Bradford County. In Section B, we can see that the operator is reporting 3,156.79 tons of drill cuttings. In Section C on pages 2-3, we can see that portions of this waste were sent to Alliance Landfill in Lackawana County, Phoenix Resources in Tioga County, Casella in Chemung County, New York, Tunnel Hill Reclamation in Perry County, Ohio, and NTSWA Landfill #2 in Bradford County.
It’s a long document, so we are going to skip all the way down to the Client Sample Results section showing the chemical analysis performed by Eurofins TestAmerica, which is on PDF pages 17-20, or pages 13-16 of the lab report itself. This lab formats non-detected analytes in black text and with an “ND” in the results column. Analytes at detectable limits are shown in blue, with the Result being paired with the item in the Unit column. The first one that we come across is 1,2,4-Trimethylbenzene, which is present at 22.1 milligrams per kilogram (mg/kg, and the next detected analyte is Ethylbenzene, at 3.3 mg/kg.
If you are not a chemist and would like to understand more about the nature of these chemicals, you can look many of them up on the Open-FF Chemical Hazard Aggregator. Gary Allison, Open-FF Founder and FracTracker Consultant, designed this tool to describe the relative hazards of chemicals that were reported as components of the injection fluid to FracFocus, the industry’s chemical disclosure registry that is required by many states, including Pennsylvania. For that trimethylbenzene isomer, for example, we can see that PubChem gives the following warnings:

Further down, we see that the sample also contains 82,200 mg/Kg of diesel range organics and 40.9 milligrams per liter (mg/L) of strontium, another chemical tied to significant health concerns. EPA considers strontium levels under 4 mg/L to be safe for consumption throughout one’s lifetime (see page 17).
No radiological analyses were performed on this drill cuttings sample, so let’s pivot to the wastewater sample, where such tests were conducted.
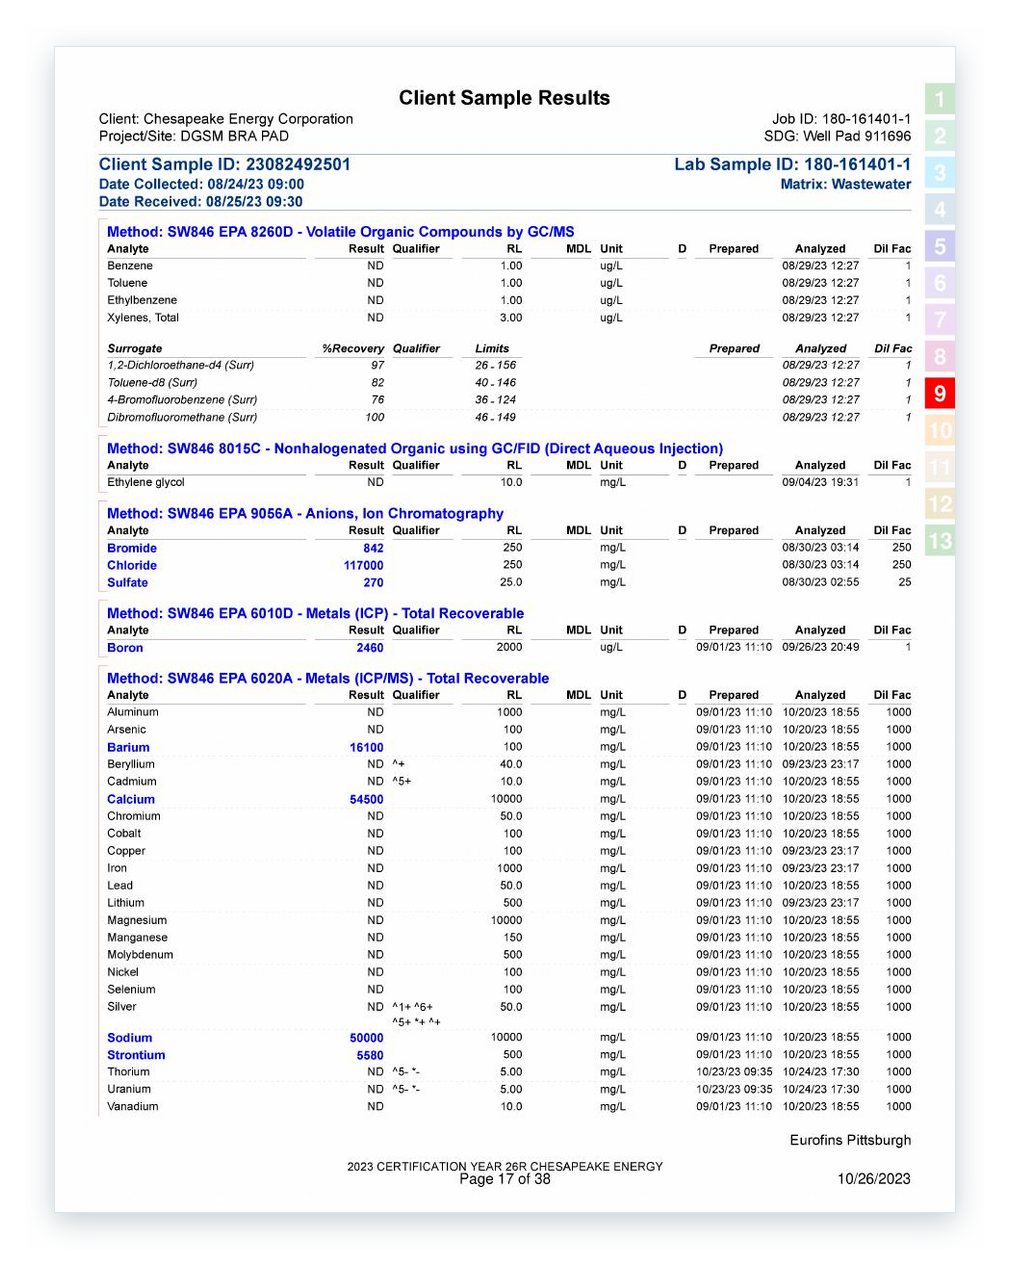
As with the drill cuttings sample, this analysis was conducted by Eurofins for a Chesapeake well. In this case, we don’t have the associated 26R report, but there is a chain of custody form on page 35 that indicates this sample is associated with the DGSM Bra well pad, another well pad in Bradford County. The Client Sample Results are on pages 17-18, and include a contaminant profile that is different from the drill cuttings sample, including:
- Chlorides – 117,000 mg/L. For reference, sea water typically has chlorides around 19,000 mg/L, making this sample six times saltier.
- Strontium – 5,580 mg/L. This is 1,395 times the lifetime standard of 4 mg/L, mentioned above
- Barium – 16,100 mg/L. This is 8,050 times the legal limit for drinking water
- Calcium – 54,500 mg/L. The US Geological Survey considers hard water to be 121 mg/L or above of combined calcium and magnesium. Magnesium was a non-detect (based on a 10,000 mg/L reporting limit), but the calcium values certainly explain why operators inject anti-scaling agents downhole, as that is enough to gum up any pipe.
- Radium-226 – 8,570 picocuries per liter (pCi/L) – Radium is a dangerous radioactive element. This isotope decays into Radon-222 by ejecting an alpha particle.
- Radium-228 – 1,320 pCi/L. Another dangerous radium isotope. The legal drinking water limit for the two combined isotopes of radium is 5 pCi/L (see page 17), making this sample 1,978 times this amount.
Browsing through the reports, note that this is just a sampling of the chemicals of interest. Even though we are just looking at a few examples of the 26R reports and their associated lab reports, we can already see that there are enormous waste quantities with highly concentrated contaminant loads being sent to locations throughout Pennsylvania and neighboring states. In that first document, we see drill cuttings sent from one well pad to five destinations in three different states. In the second, the 26R report became disassociated, but the lab report shows us chemicals of concern in very high quantities that have the potential to impact neighbors and the environment of the sites where this waste is brought to the surface, handled, transferred, and disposed of.
Conclusion
The Pennsylvania DEP’s oil and gas waste report provides quite a bit of insight into the waste streams created by the nation’s second largest gas producer. We know that operators of the state’s oil and gas waste wells reported around 72.6 million barrels of liquid waste and 825,000 tons of solid waste. We know the state’s unconventional wells, despite representing less than 15% of the total wells, account for nearly 99% of liquids and almost 100% of solid waste on the report. We know that about 97% of all liquid waste is categorized as produced fluids, which in recent years includes both brine and flowback fluids. Similarly, almost 86% of solid waste on the report is drill cuttings. We know that while some of the waste is sent as far away as Montana or Arkansas, over 90% of the liquids and 81% of the solids on the report stay in-state.
We also know a significant amount about what’s in the waste, making it clear that this waste can pose a serious threat to public health. Our review of the laboratory reports submitted as part of 26R forms document some waste streams containing striking concentrations of chloride, barium, strontium, petroleum compounds, and radioactive radium. One wastewater sample, for example, contained a combined 9,890 picocuries per liter of radium-226 and radium-228—nearly 2,000 times EPA’s drinking-water limit.
And yet, digging through the data to find these answers have created just as many questions. We don’t know why there are 48,545 wells that report some amount of oil and gas production but zero waste generation. Despite reports of it occurring, we can’t quantify the practice of road spreading brine for dust suppression or de-icing on Pennsylvania roads. We don’t know the volumes of waste coming into Pennsylvania from neighboring states, or why a Pennsylvania operator would pay to have several tanker trucks worth of drilling waste shipped all the way to Montana. We don’t know the exact location of some of the receiving facilities, nor do we know what happens to much of the waste beyond some of the temporary arrangements designated on the report. We also don’t have chemical lab analyses for all of the wells
As a reminder, around 1 in 4 Pennsylvanians rely on private well water for their drinking source. The facilities that extract, store, and process this waste can’t remove the contaminant load with a flick of the wrist, and there really isn’t a great place for any of it, short of keeping it in situ. Many of the residents that bring up concerns about pollution from O&G waste are worried about contamination of their water supplies and the potential for permanent health effects. If we return to that imagery of two Empire State Buildings worth of solid waste, and of watching the water flow over Niagara Falls for 67 minutes, we do so with the knowledge that this waste created in Pennsylvania every year is anything but benign. And while RCRA and DEP may sanitize the language by categorizing this waste “residual” instead of “hazardous”, that does nothing to sanitize the water itself.
FracTracker Alliance helps communicate the risks of oil and gas and petrochemical development to advance just energy alternatives that protect public health, natural resources, and the climate.
By contributing to FracTracker, you are helping to make tangible changes, such as decreasing the number of oil and gas wells in the US, protecting the public from toxic and radioactive chemicals, and stopping petrochemical expansion into vulnerable communities.
Your donations help fund the sourcing and analysis of new data so that we can keep you informed and continually update our resources.
Please donate to FracTracker today as a way to advocate for clean water, clean air, and healthy communities.
Donate now
Leave a Reply
Want to join the discussion?Feel free to contribute!